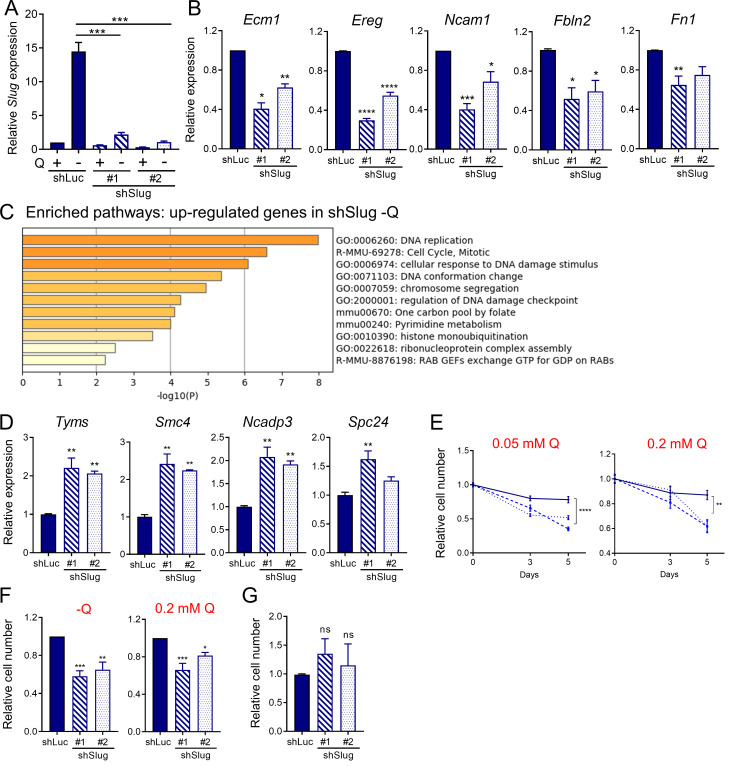
Figure S3.
Slug regulates EMT and survival upon glutamine starvation. (A) Relative Slug mRNA expression by qPCR in KPC Slug knockdown cells compared with control (shLuc) in glutamine-replete or glutamine-free medium for 24 h. Results are expressed relative to shLuc/+Q condition. Data are shown as mean ± SEM; n = 5 independent experiments. (B) Relative expression of the indicated EMT-related genes in KPC Slug knockdown compared with shLuc in glutamine-free medium for 24 h. Results are expressed relative to shLuc. Data are shown as mean ± SEM; n = 3 independent experiments. (C) Chart showing enriched pathways among the genes up-regulated in Slug-depleted KPC cells compared with control (shLuc) in glutamine-free conditions. The graph was generated with Metascape. (D) Relative expression of the indicated genes in KPC Slug knockdown compared with shLuc in glutamine-free medium for 24 h. Results are expressed relative to shLuc. The results are representative of three independent experiments. Data are presented as the mean ± SEM of three replicates. (E) Relative cell number assessed by Syto60 staining in KPC shLuc, shSlug#1, or shSlug#2 cells incubated in medium containing 0.05 or 0.2 mM glutamine for 3 and 5 d. Representative data are shown for n = 3 independent experiments with three to five replicates each. (F) Relative cell number assessed by crystal violet staining in KPC shLuc, shSlug#1, or shSlug#2 cells incubated in glutamine-free medium or medium containing 0.2 mM glutamine for 5 or 6 d. Data are normalized to day 0 for each cell line and are shown relative to the shLuc control. Results are expressed as mean ± SEM; n = 5 independent experiments. (G) Relative cell number assessed by crystal violet staining in KPC shLuc, shSlug#1, or shSlug#2 incubated in complete medium for 48 h. Results are expressed as mean ± SEM; n = 4 independent experiments. ns, not significant. Statistical significance was determined using unpaired Student’s t test in A and one-way ANOVA followed by Dunnett's test for multiple comparisons in B–G. All data are representative of at least three independent experiments. *, P < 0.05; **, P < 0.01; ***, P < 0.001; ****, P < 0.001.

