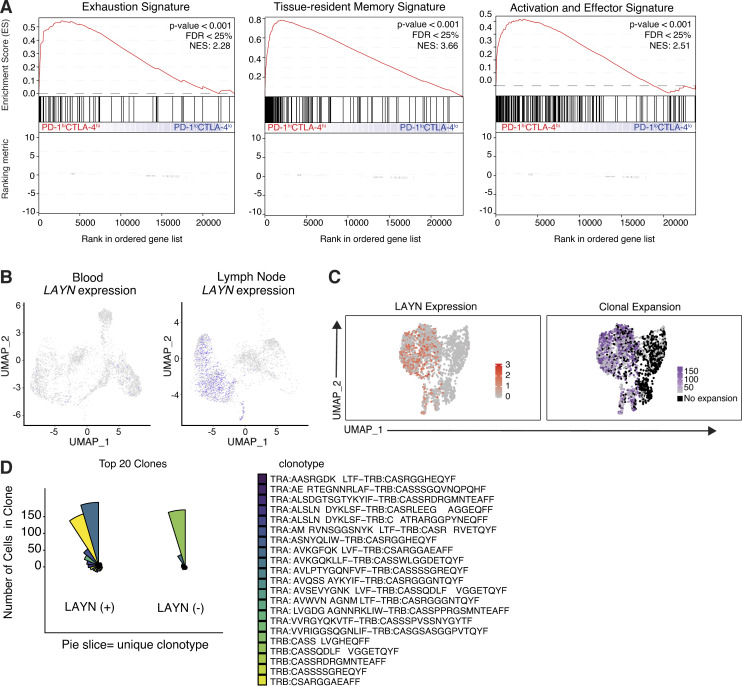
Figure S2.
Comparative scRNA-seq analysis of human melanoma CD8+ TIL subsets. (A) Gene set enrichment analysis showing enrichment of exhaustion, tissue-resident memory, and activation and effector function signatures genes within the ranked gene expression of PD-1hiCTLA-4hi compared with PD-1loCLTA-4lo CD8+ TILs from human melanoma (n = 5). NES, normalized enrichment score. (B) Matched tissue scRNA-seq of CD8+ T cells isolated from patient K-411. (C) UMAP plots generated from scRNA-seq and scTCR-seq demonstrating LAYN expression and clone size from K-409 primary tumor. Clones are defined as sets of cells with perfect matches for all called TCR α and β chains from single-cell TCR data. (D) Coxcomb plots showing the 20 most expanded LAYN+ and LAYN− clones in K-409 primary tumor. Each pie slice represents a unique CD8+ T cell clonotype, and pie slice height is proportional to clone size. FDR, false discovery rate.

