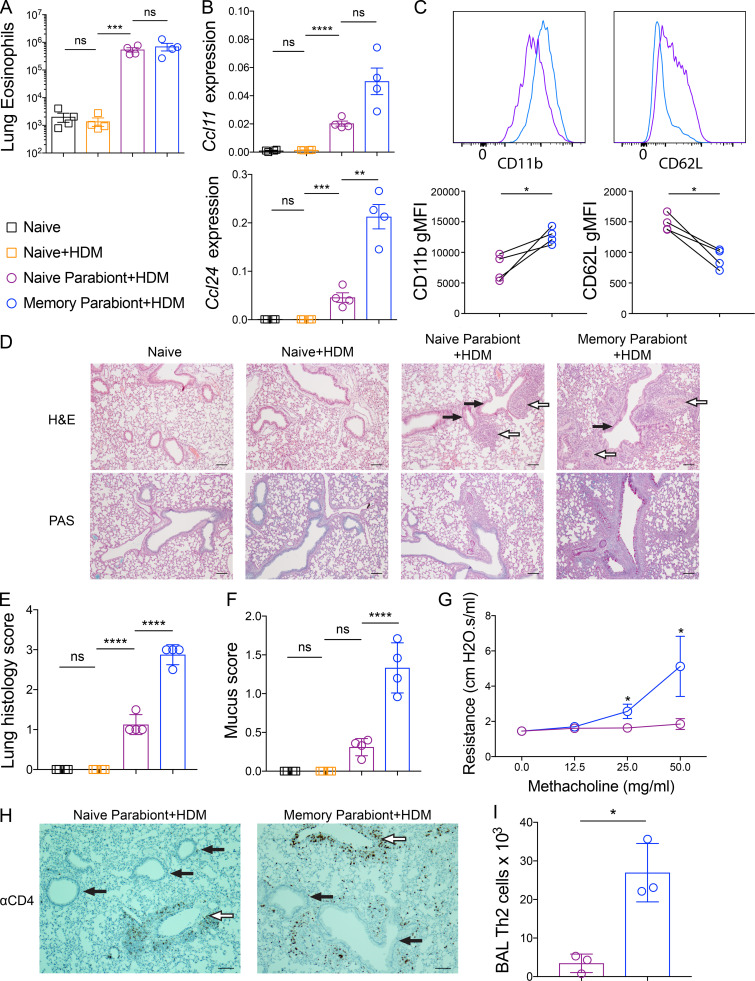
Figure 3.
Th2 Trm cells and circulating memory Th2 cells perform nonredundant functions upon HDM rechallenge. (A–I) CD45.2 HDM-memory mice were surgically conjoined to CD45.1 naive mice. After 3–4 wk, both parabionts received a single dose of i.n. HDM with harvest of lung or BAL after 72 h. (A) Quantitation of eosinophils (anti-CD45 i.v. unlabeled, CD11cloSiglec-F+ cells) from the lung parenchyma of indicated groups. (B) Lung Ccl11 and Ccl24 relative RNA levels assessed via qPCR. (C) Representative histograms demonstrating BAL eosinophil cell surface expression of CD11b and CD62L (top panel) and geometric mean fluorescence intensity (gMFI; bottom panel) from naive parabionts (purple circles) and memory parabionts (blue circles) as determined by flow cytometry. (D) H&E-stained (top panel) and PAS-stained (bottom panel) lung sections from indicated groups. White arrows indicate blood vessels, and black arrows indicate airways. Scale bars represent 100 µm. (E) Lung histology scores. (F) Mucus scores. (G) Airway resistance was measured in indicated group after increasing doses of methacholine. (H) Immunohistochemistry for lung CD4+ T cells in naive and memory parabionts 72 h after HDM challenged. White arrows indicate blood vessels, and black arrows indicate airways. Scale bars represent 100 µm. (I) BAL Th2 cells (FoxP3−GATA3+CD4+ T cells) were quantitated in indicated groups via flow cytometry. Representative data show individual mice with mean ± SEM from one of three independent experiments with three to four mice per group (A–F and H–I) or mean ± SEM from two cumulative experiments with four mice per group (G). For statistical analysis, one-way ANOVA analysis with Holm-Sidak’s testing was used for statistical analysis of multiple groups with paired two-tailed t tests for comparison on naive and memory parabiont groups. *, P < 0.05; **, P < 0.01; ***, P < 0.001; ****, P < 0.0001.

