Figure S3.
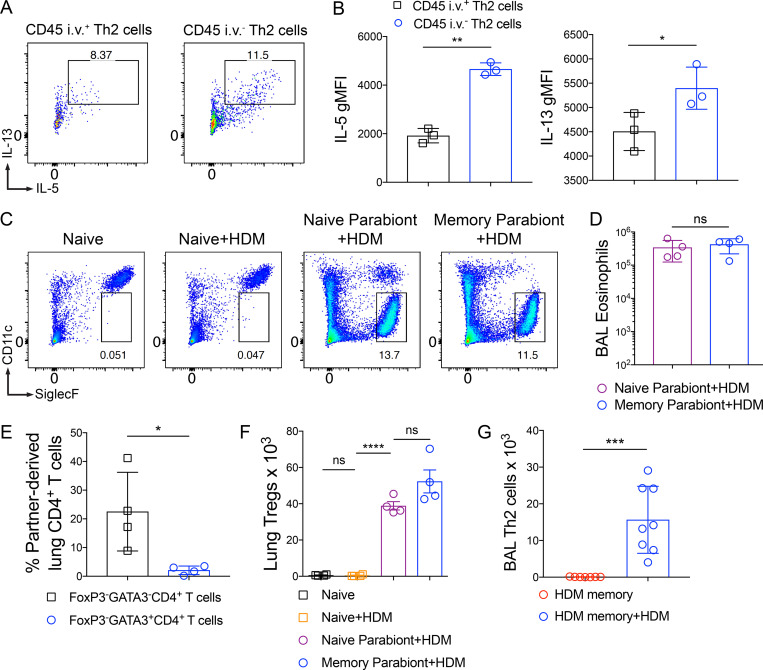
Function and trafficking of tissue-resident and circulating memory Th2 cells in HDM-memory mice. (A and B) C57BL/6 mice were sensitized and challenged with i.n. HDM and rested for 6–12 wk. (A) Lung cells from HDM-memory mice underwent CD4+ T cell negative selection followed by treatment with anti-CD3 and anti-CD28 for 12–16 h. Representative flow cytometry of anti-CD45 i.v. unlabeled (intraparenchymal) and labeled (intravascular) Th2 cells after intracellular cytokine staining for IL-5 and IL-13. (B) Geometric mean fluorescence intensity (gMFI) for IL-5 and IL-13 expression in indicated groups. (C and D) CD45.2 HDM-memory mice were surgically conjoined to CD45.1 naive mice. After 3–4 wk, both parabionts received a single dose of i.n. HDM with harvest of mLN and lung after 72 h. (C) Representative flow cytometry of lung parenchymal eosinophils (anti-CD45 i.v. unlabeled, CD11cloSiglec-F+ cells) from indicated groups. (D) Quantitation of BAL eosinophils from indicated groups. (E) CD45.2 and CD45.1 HDM-memory mice were surgically conjoined. After 3–4 wk, lungs from both parabionts were harvested. Quantitation of percent partner-derived lung memory CD4+ T cells (anti-CD45 i.v. unlabeled, FoxP3−GATA3−CD4+ T cells and FoxP3−GATA3+CD4+ T cells) assessed via flow cytometry. (F) CD45.2 HDM-memory mice were surgically conjoined to CD45.1 naive mice. After 3–4 wk, both parabionts received a single dose of i.n. HDM with harvest of lungs after 72 h. Lung FoxP3+CD4+ T cells (T regs) were quantitated via flow cytometry. (G) Individual HDM-memory mice were left untreated or received a single dose of i.n. HDM with BAL after 72 h. BAL Th2 cells were quantitated via flow cytometry. Representative data show individual mice with mean ± SEM from one of two independent experiments with three or four mice per group (A and B), or one of three independent experiments with three or four mice per group (C, D, and F) or cumulative data from two independent experiments (E and G). For statistical analysis, a two-tailed t test was performed for parametric data (B and G). One-way ANOVA analysis with Holm-Sidak’s testing was used for statistical analysis of multiple groups with paired two-tailed t tests for comparison of parabionts (D and F). A two-tailed Mann-Whitney U test was performed for nonparametric data (E). *, P < 0.05; **, P < 0.01; ***, P < 0.001; ****, P < 0.0001.

