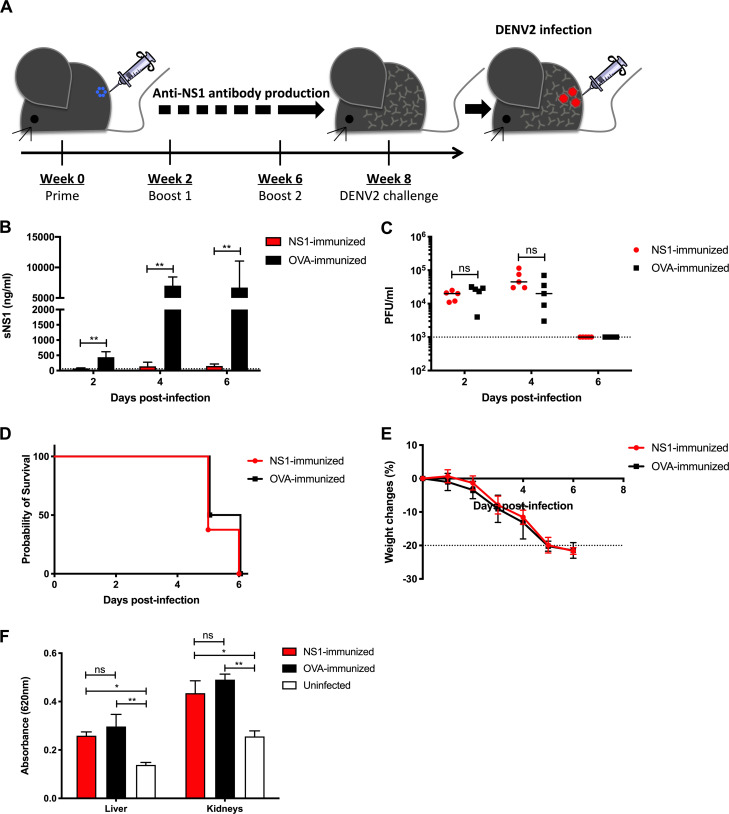
Figure 3.
NS1 immunization in IFNAR−/− primary infection model. (A) IFNAR−/− mice were immunized with NS1(16681) or OVA as described in the legend of Fig. 1. 8 wk after immunization, mice were challenged s.c. with 105 PFU D2Y98P. (B and C) Systemic sNS1 levels (B) and viremia titers (C) were measured at days 2, 4, and 6 p.i. (n = 5). (D and E) Mice (n = 6–8) were monitored daily upon challenge. Kaplan–Meier survival curve and weight loss profile are shown. (F) Vascular leakage was assessed in liver and kidneys at day 4 p.i. (n = 4–5). Data are representative of at least two independent experiments. Data were analyzed by nonparametric Mann–Whitney U test. *, P < 0.05; **, P < 0.01; ns, not significant. Results were expressed as averages ± SD (B, E, and F).

