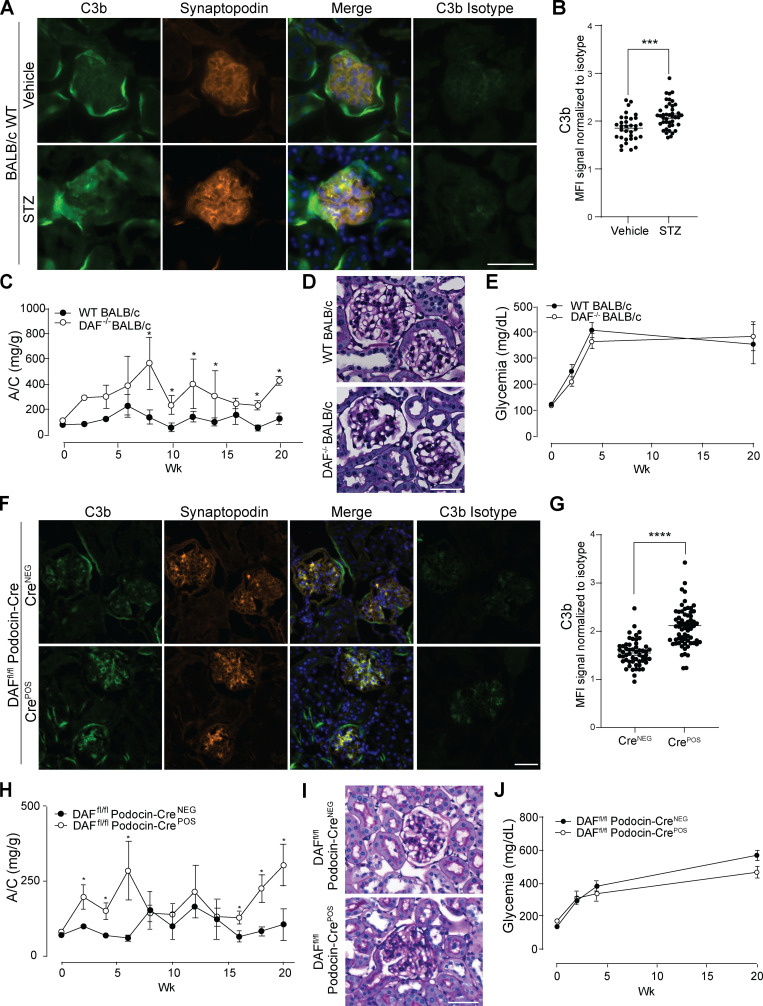
Figure 4.
Glomerular DAF downregulation promotes murine STZ-induced diabetic kidney disease. (A and B) Representative pictures (A) and data quantification (B) of glomerular C3b in BALB/c WT mice at 5 wk after vehicle or STZ injection. ***P < 0.001. (C and D) Urinary A/C at weekly intervals (C) and representative renal histological (PAS) lesions (D) of male WT (n = 8) or DAF−/− (n = 5) BALB/c mice sacrificed at 5 wk after STZ injection (50 mg/kg, i.p., for five consecutive days). *P < 0.05 versus WT at the same time point. (E) Glycemic levels of mice injected with STZ shown in A–D. (F and G) Representative pictures (F) and data quantification (G) of glomerular C3b in DAFfl/fl podocin-CreNEG/POS B6 mice at 5 wk after STZ injection. ****P < 0.001. (H and I) Urinary A/C at weekly intervals (H) and representative renal histological (PAS) lesions (I) of male DAFfl/fl podocin-CreNEG (n = 9) or podocin-CrePOS (n = 8) B6 mice sacrificed at 20 wk after STZ injection (50 mg/kg, i.p., for five consecutive days). *P < 0.05 versus DAFfl/fl podocin-CreNEG at the same time point. (J) Glycemic levels of mice injected with STZ shown in H and I. Only mice that reached glycemia >300 mg/dl at 2 wk after STZ injection were included in this set of experiments. All experimental data were verified in at least three independent experiments. Scale bars: 50 µm. Error bars are SEM.

