Figure 1.
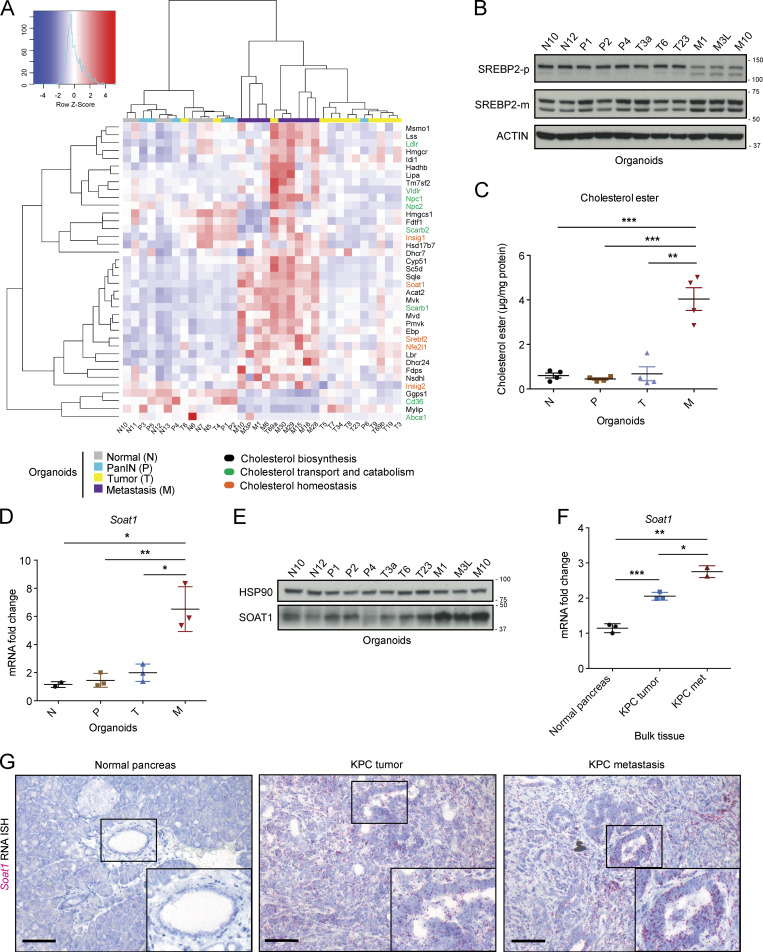
SOAT1 expression increases during PDAC progression. (A) RNA-seq analysis of murine normal N (n = 7), PanIN P (n = 6), tumor T (n = 12), and metastatic M (n = 9) pancreatic organoids showing genes involved in cholesterol biosynthesis (black), transport and catabolism (green), and homeostasis (orange). The color scheme of the heat map represents Z-score distribution. (B) Western blot analysis of the inactive SREBP2 precursor (SREBP2-p) and the mature SREBP2 protein (SREBP2-m) in a panel of N (n = 2), P (n = 3), T (n = 3), and tumor-matched M (n = 3) organoids. ACTIN, loading control. (C) Cholesterol ester assays for N (n = 4), P (n = 4), T (n = 4), and tumor-matched M (n = 4) organoids. Results show mean ± SEM of two biological replicates (two technical replicates each). **, P < 0.01; ***, P < 0.001, paired Student’s t test. (D) qPCR analysis of Soat1 in murine pancreatic N (n = 2), P (n = 3), T (n = 3), and tumor-matched M (n = 3) organoids. Results show mean ± SEM. *, P < 0.05; **, P < 0.01, paired Student’s t test between matched T and M organoids; unpaired Student’s t test between N, P, and M organoids. (E) Western blot analysis of SOAT1 in N (n = 2), P (n = 3), T (n = 3), and tumor-matched M (n = 3) organoids shown in B. HSP90, loading control. (F) qPCR analysis of Soat1 in C57BL/6J normal pancreata (n = 3), KPC tumors (n = 3), and KPC metastases (n = 2). Results show mean ± SEM. *, P < 0.05; **, P < 0.01; ***, P < 0.001, unpaired Student’s t test. (G) Representative RNA ISH of Soat1 in C57BL/6J normal pancreas (n = 3), KPC tumor (n = 3), and matched metastasis (n = 3). Inserts: magnification. Scale bars, 200 µm. Molecular weights in kilodaltons.

