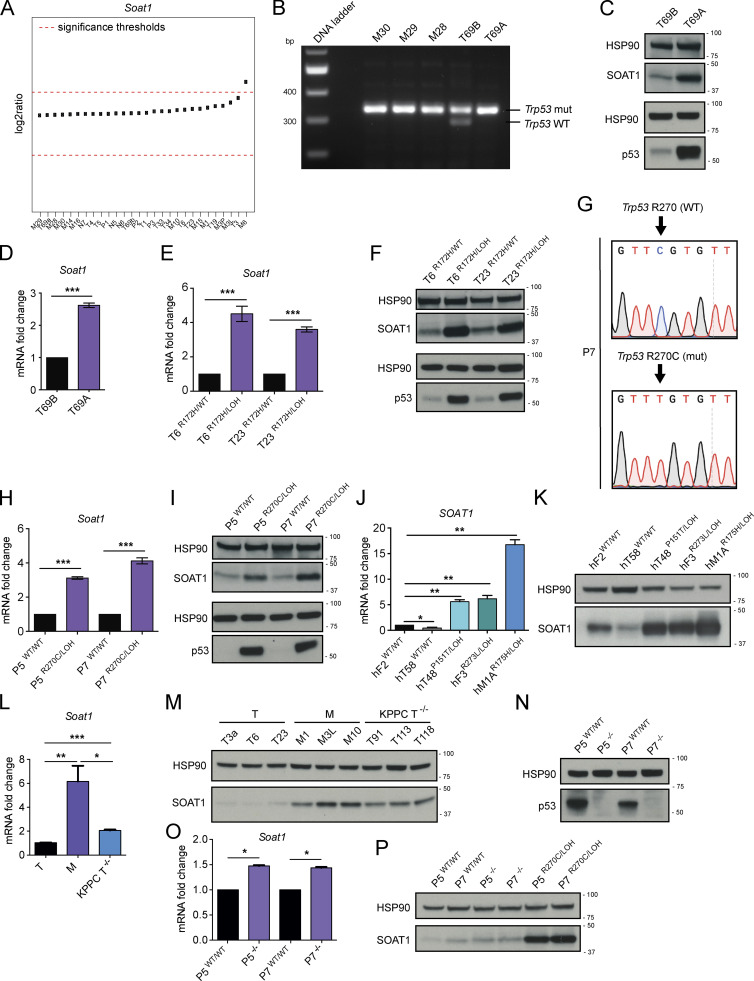
Figure 2.
SOAT1 expression is dependent on p53 status. (A) Copy number variation analysis of Soat1 in murine N (n = 3), P (n = 3), T (n = 11), and M (n = 11) pancreatic organoids. (B) DNA gel showing Trp53 genetic status in metastatic (n = 3, M30, M29, and M28) and tumor (n = 2, T69B and T69A) PDAC organoids. T69B and T69A were generated from two primary tumors of the same KPC mouse. mut, mutant. (C) Western blot analysis of SOAT1 and p53 in T69B and T69A organoids (n = 2). HSP90, loading controls. (D) qPCR analysis of Soat1 in T69A and T69B organoids. Results show mean ± SD of two technical replicates. ***, P < 0.001, paired Student’s t test. (E) qPCR analysis of Soat1 in T6 and T23 organoids with or without p53 LOH. Results show mean ± SD of two technical replicates. ***, P < 0.001, paired Student’s t test. (F) Western blot analysis of SOAT1 and p53 in T6 and T23 organoids with or without p53 LOH. HSP90, loading controls. (G) DNA sequencing results showing Trp53 mutation following base-editing in P7 organoids. (H) qPCR analysis of Soat1 in P5 and P7 organoids with p53WT/WT or p53R270C/LOH. Results show mean ± SD of three technical replicates. ***, P < 0.001, paired Student’s t test. (I) Western blot analysis of SOAT1 and p53 in P5 and P7 organoids with p53WT/WT or p53R270C/LOH. HSP90, loading controls. (J) qPCR analysis of SOAT1 in a panel of human PDAC organoids with either mutant or WT p53. Results show mean ± SD of three technical replicates. *, P < 0.05; **, P < 0.01, paired Student’s t test. Human PDAC organoids were derived from resections of primary tumors (hT), fine needle aspirates/biopsies of primary tumors (hF) or metastases (hM). (K) Western blot analysis of SOAT1 in a panel of human PDAC organoids with either mutant or WT p53 (n = 2). HSP90, loading control. (L) qPCR analysis of Soat1 in KPC T (T3a, T6, and T23) and M (M1, M3L, and M10) organoids and in KPPC T−/− (T91, T113, and T118) organoids. Results show mean ± SD of three biological replicates. *, P < 0.05; **, P < 0.01; ***, P < 0.001, unpaired Student’s t test. (M) Western blot analysis of SOAT1 in T (n = 3), M (n = 3), and T−/− (n = 3) organoids. HSP90, loading control. (N) Western blot analysis of p53 in P5 and P7 organoids with p53WT/WT or p53−/−. HSP90, loading control. (O) qPCR analysis of Soat1 in P5 and P7 organoids with p53WT/WT or p53−/−. Results show mean ± SD of two technical replicates. *, P < 0.05, paired Student’s t test. (P) Western blot analysis of SOAT1 in P5 and P7 organoids with p53WT/WT, p53−/− or p53R270C/LOH. HSP90, loading control. Molecular weights in kilodaltons.

