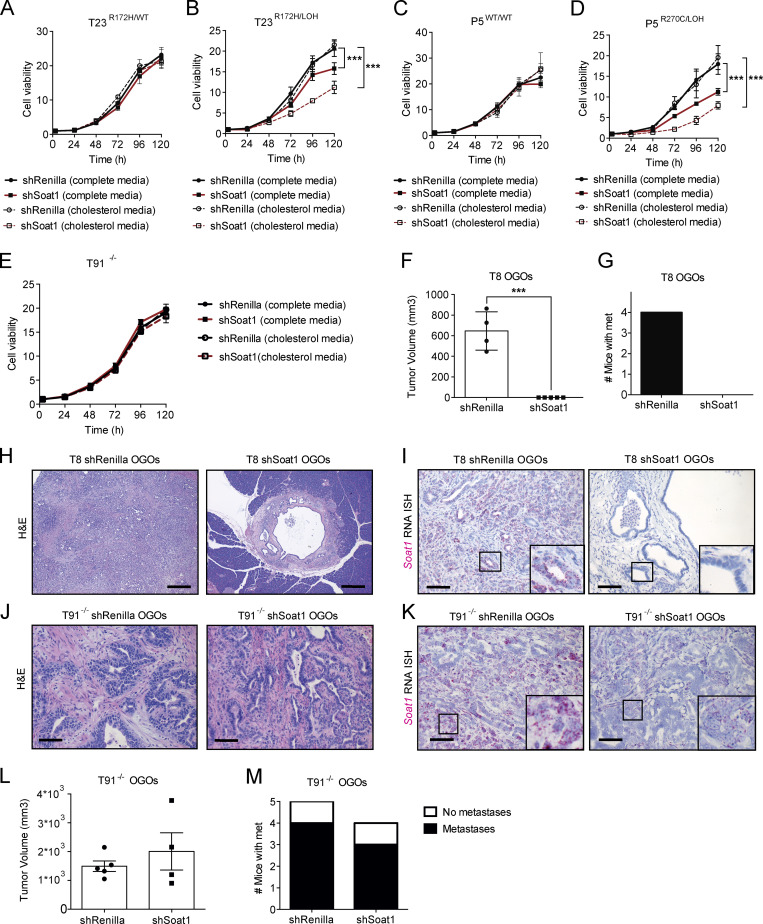
Figure 4.
p53 LOH sensitizes tumor cells to SOAT1 deficiency. (A) Proliferation curves of T23R172H/WT organoids with or without expression of an shRNA targeting Soat1 in complete media or complete media containing 50 µM cholesterol. Results show mean ± SD of five technical replicates. No statistical difference was found, as calculated by unpaired Student’s t test for the last time point. (B) Proliferation curves of T23R172H/LOH organoids with or without expression of an shRNA targeting Soat1 in complete media or complete media containing 50 µM cholesterol. Results show mean ± SD of five technical replicates. ***, P < 0.001, unpaired Student’s t test calculated for the last time point. (C) Proliferation curves of P5WT/WT organoids with or without expression of an shRNA targeting Soat1 in complete media or complete media containing 50 µM cholesterol. Results show mean ± SD of five technical replicates. No statistical difference was found, as calculated by unpaired Student’s t test for the last time point. (D) Proliferation curves of P5R270C/LOH organoids with or without expression of an shRNA targeting Soat1 in complete media or complete media containing 50 µM cholesterol. Results show mean ± SD of five technical replicates. ***, P < 0.001, unpaired Student’s t test calculated for the last time point. (E) Proliferation curves of T91−/− organoids with or without expression of an shRNA targeting Soat1 in complete media or complete media containing 50 µM cholesterol. Results show mean ± SD of five technical replicates. No statistical difference was found, as calculated by unpaired Student’s t test for the last time point. (F) Quantification of tumor volumes of T8 OGO models with (n = 5) or without (n = 4) expression of an shRNA targeting Soat1 in NOD scid gamma mice on day 58 after transplantation. Results show mean ± SEM. ***, P < 0.001, unpaired Student’s t test. (G) Quantification of mice with metastases for the experiment shown in F. (H) Representative H&E stain of T8 OGO models with or without expression of an shRNA targeting Soat1 for the experiment shown in F (n = 2). Scale bars, 800 µm. (I) Representative RNA ISH of Soat1 in T8 OGO models with or without expression of an shRNA targeting Soat1 for the experiment shown in F (n = 2). Inserts: magnification. Scale bars, 200 µm. (J) Representative H&E stain of T91−/− OGO models with or without expression of an shRNA targeting Soat1 in nu/nu mice on day 73 after transplantation (n = 2). Scale bars, 200 µm. (K) Representative RNA ISH of Soat1 in T91−/− OGO models for the experiment shown in J (n = 2). Inserts: magnification. Scale bars, 200 µm. (L) Quantification of tumor volumes of T91−/− OGO models with (n = 4) or without (n = 5) expression of an shRNA targeting Soat1 for the experiment shown in J. Results show mean ± SEM. No statistical difference was found, as calculated by unpaired Student’s t test. (M) Quantification of mice with metastases for the experiment shown in L.

