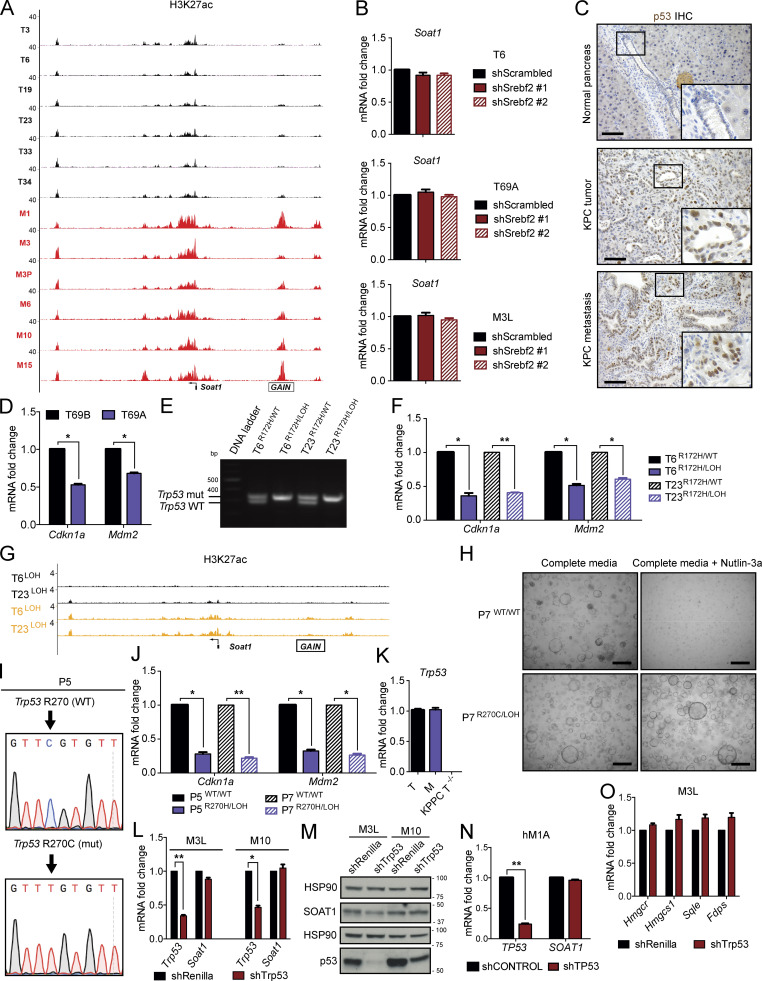
Figure S2.
SOAT1 expression is dependent on p53 status. (A) Representative H3K27ac ChIP-seq profiles at the Soat1 locus in matched T (n = 6) and M (n = 6) organoids. (B) qPCR analyses of Soat1 in T6, T69A, and M3L organoids with or without expression of two different shRNAs targeting Srebf2. Results show mean ± SD of two technical replicates. No statistical difference was found, as calculated by paired Student’s t test. (C) Representative IHC of p53 in C57BL/6J normal pancreas (n = 3), KPC tumor (n = 3), and metastasis (n = 3). Inserts: magnification. Scale bars, 200 µm. (D) qPCR analysis of Cdkn1a and Mdm2 in T69B and T69A organoids. Results show mean ± SD of two technical replicates. *, P < 0.05, paired Student’s t test. (E) DNA gel showing Trp53 genetic status in T6 and T23 organoids with or without p53 LOH. mut, mutant. (F) qPCR analysis of Cdkn1a and Mdm2 in T6 and T23 organoids with or without p53 LOH. Results show mean ± SD of two technical replicates. *, P < 0.05; **, P < 0.01, paired Student’s t test. (G) Representative H3K27ac ChIP-seq profiles at the Soat1 locus in T6 and T23 organoids with or without p53 LOH. (H) Representative bright-field images of P7 with p53WT/WT or p53R270C/LOH in complete media or complete media containing 10 µM Nutlin-3a. Scale bars, 800 µm. (I) DNA sequencing results showing Trp53 mutation following base-editing in P5 P organoids. (J) qPCR analysis of Cdkn1a and Mdm2 in P5 and P7 organoids with p53WT/WT or p53R270C/LOH. Results show mean ± SD of two technical replicates. *, P < 0.05; **, P < 0.01, paired Student’s t test. (K) qPCR analysis of Trp53 in T (T3a, T6, and T23), M (M1, M3L, and M10), and KPPC T−/− (T91, T113, and T118) organoids. Results show mean ± SD of three biological replicates. No Trp53 transcript was detected in the three T−/− organoid lines. (L) qPCR analysis of Trp53 and Soat1 in M3L and M10 organoids with or without expression of an shRNA targeting Trp53. Results show mean ± SD of two technical replicates. *, P < 0.05; **, P < 0.01, paired Student’s t test. (M) Western blot analysis of p53 and SOAT1 in M3L and M10 organoids with or without expression of an shRNA targeting Trp53 (n = 2). HSP90, loading controls. Molecular weights in kilodaltons. (N) qPCR analysis of TP53 and SOAT1 in hM1A organoids with or without expression of an shRNA targeting TP53. Results show mean ± SD of two technical replicates. **, P < 0.01, paired Student’s t test. (O) qPCR analysis of Hmgcr, Hmgcs1, Sqle, and Fdps in M3L organoids with or without expression of an shRNA targeting Trp53. Results show mean ± SD of two technical replicates. No statistical difference was found, as calculated by paired Student’s t test.

