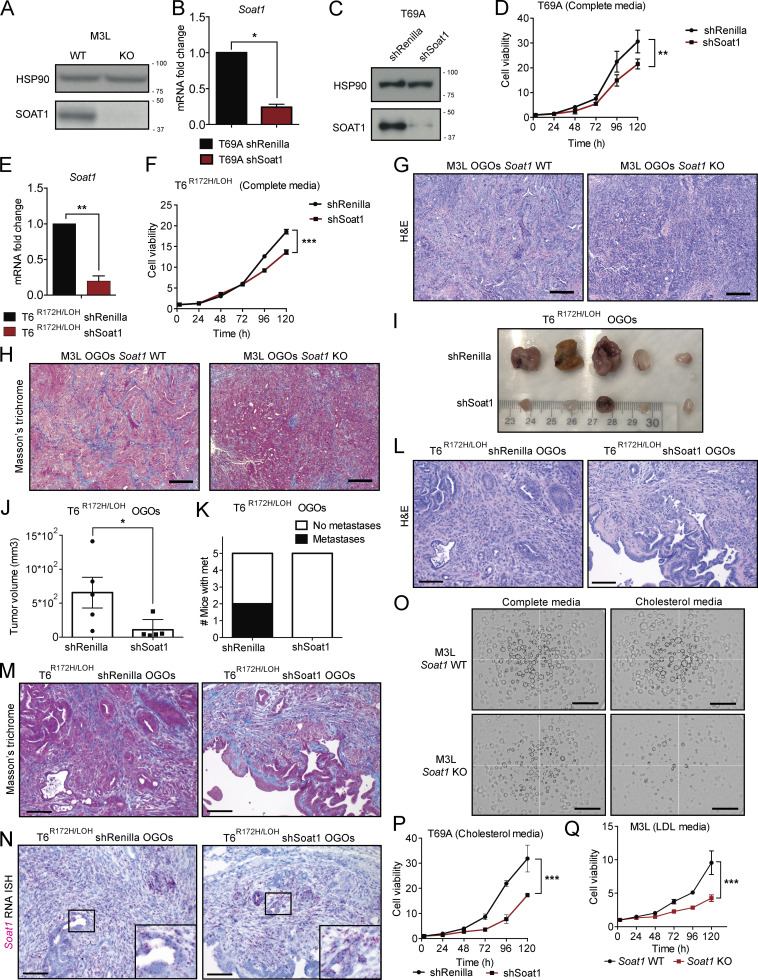
Figure S3.
SOAT1 loss significantly impairs PDAC progression. (A) Western blot analysis of SOAT1 in M3L organoids with Soat1 WT or KO (n = 2). HSP90, loading control. Molecular weights in kilodaltons. (B) qPCR analysis of Soat1 in T69A organoids with or without expression of an shRNA targeting Soat1. Results show mean ± SD of two technical replicates. *, P < 0.05, paired Student’s t test. (C) Western blot analysis of SOAT1 in T69A organoids with or without expression of an shRNA targeting Soat1 (n = 2). HSP90, loading control. Molecular weights in kilodaltons. (D) Proliferation curves of T69A organoids with or without expression of an shRNA targeting Soat1. Results show mean ± SD of five technical replicates. **, P < 0.01, unpaired Student’s t test calculated for the last time point. (E) qPCR analysis of Soat1 in T6R172H/LOH organoids with or without expression of an shRNA targeting Soat1. Results show mean ± SD of three technical replicates. **, P < 0.01, paired Student’s t test. (F) Proliferation curves of T6R172H/LOH organoids with or without expression of an shRNA targeting Soat1. Results show mean ± SD of five technical replicates. ***, P < 0.001, unpaired Student’s t test calculated for the last time point. (G) Representative H&E stain of M3L OGO models with Soat1 WT or KO (n = 3). Scale bars, 400 µm. (H) Representative Masson's trichrome stain of M3L OGO models with Soat1 WT or KO (n = 3). Scale bars, 400 µm. (I) Images of T6R172H/LOH OGO models with or without expression of an shRNA targeting Soat1 in nu/nu mice at day 24 after transplantation (n = 5 per cohort). (J) Quantification of tumor volumes of T6R172H/LOH OGO models shown in I. Results show mean ± SEM of five biological replicates per cohort. *, P < 0.05, unpaired Student’s t test. (K) Number of mice with metastases for the experiment shown in I. (L) Representative H&E stain of T6R172H/LOH OGO models with or without expression of an shRNA targeting Soat1 (n = 3). Scale bars, 200 µm. (M) Representative Masson’s trichrome stain of T6R172H/LOH OGO models with or without expression of an shRNA targeting Soat1 (n = 3). Scale bars, 200 µm. (N) Representative RNA ISH of Soat1 in T6R172H/LOH OGO models with or without expression of an shRNA targeting Soat1 (n = 3). Inserts: magnification. Scale bars, 200 µm. (O) Representative bright-field images of M3L organoids with or without Soat1 KO in complete media or complete media containing 50 µM cholesterol at 96 h (n = 2). Scale bars, 800 µm. (P) Proliferation curves of T69A organoids with or without expression of an shRNA targeting Soat1 in complete media containing 50 µM cholesterol. Results show mean ± SD of five technical replicates. ***, P < 0.001, unpaired Student’s t test calculated for the last time point. (Q) Proliferation curves of M3L organoids with or without Soat1 KO in complete media containing 0.5% LDL. Results show mean ± SD of five technical replicates. ***, P < 0.001, unpaired Student’s t test calculated for the last time point.

