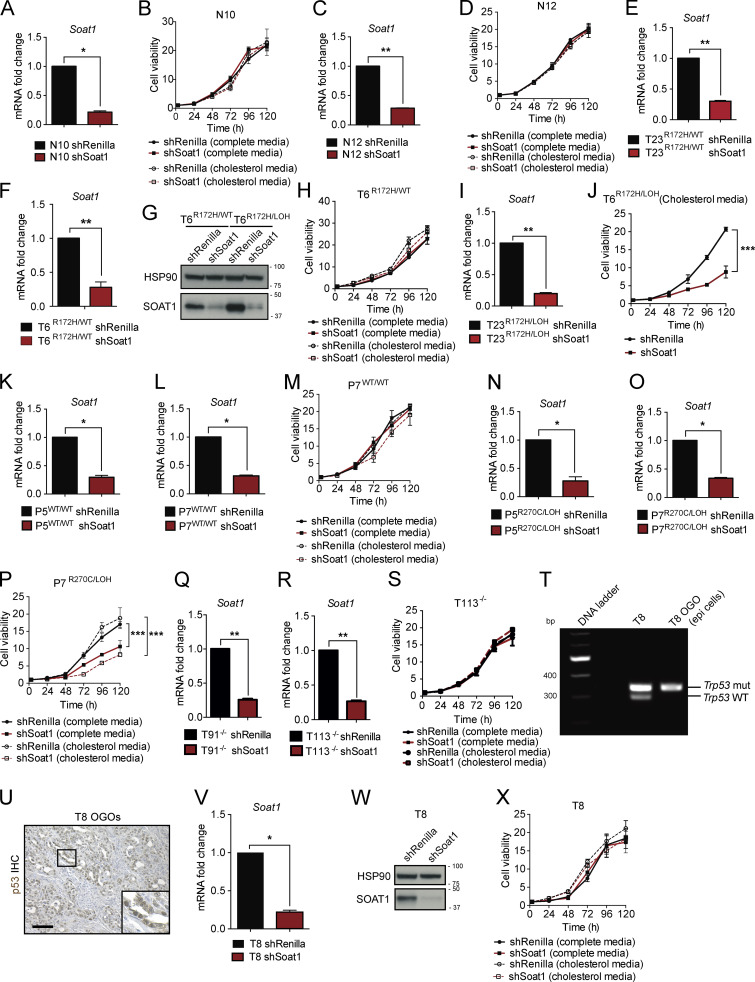
Figure S4.
p53 LOH sensitizes tumor cells to SOAT1 deficiency. (A) qPCR analysis of Soat1 in N10 N organoids with or without expression of an shRNA targeting Soat1. Results show mean ± SD of two technical replicates. *, P < 0.05, paired Student’s t test. (B) Proliferation curves of N10 organoids with or without expression of an shRNA targeting Soat1 in complete media or complete media containing 50 µM cholesterol. Results show mean ± SD of five technical replicates. No statistical difference was found, as calculated by unpaired Student’s t test for the last time point. (C) qPCR analysis of Soat1 in normal N12 organoids with or without expression of an shRNA targeting Soat1. Results show mean ± SD of two technical replicates. **, P < 0.01, paired Student’s t test. (D) Proliferation curves of N12 organoids with or without expression of an shRNA targeting Soat1 in complete media or complete media containing 50 µM cholesterol. Results show mean ± SD of five technical replicates. No statistical difference was found, as calculated by unpaired Student’s t test for the last time point. (E) qPCR analysis of Soat1 in T23R172H/WT organoids with or without expression of an shRNA targeting Soat1. Results show mean ± SD of two technical replicates. **, P < 0.01, paired Student’s t test. (F) qPCR analysis of Soat1 in T6R172H/WT organoids with or without expression of an shRNA targeting Soat1. Results show mean ± SD of three technical replicates. **, P < 0.01, paired Student’s t test. (G) Western blot analysis of SOAT1 in T6R172H//WT and T6R172H/LOH organoids with or without expression of an shRNA targeting Soat1 (n = 2). HSP90, loading control. Molecular weights in kilodaltons. (H) Proliferation curves of T6R172H/WT organoids with or without expression of an shRNA targeting Soat1 in complete media or complete media containing 50 µM cholesterol. Results show mean ± SD of five technical replicates. No statistical difference was found, as calculated by unpaired Student’s t test for the last time point. (I) qPCR analysis of Soat1 in T23R172H/LOH organoids with or without expression of an shRNA targeting Soat1. Results show mean ± SD of two technical replicates. **, P < 0.01, paired Student’s t test. (J) Proliferation curves of T6R172H/LOH organoids with or without expression of an shRNA targeting Soat1 in complete media containing 50 µM cholesterol. Results show mean ± SD of five technical replicates. ***, P < 0.001, unpaired Student’s t test calculated for the last time point. (K) qPCR analysis of Soat1 in P5 P organoids with p53WT/WT with or without expression of an shRNA targeting Soat1. Results show mean ± SD of two technical replicates. *, P < 0.05, paired Student’s t test. (L) qPCR analysis of Soat1 in P7 organoids with p53WT/WT with or without expression of an shRNA targeting Soat1. Results show mean ± SD of two technical replicates. *, P < 0.05, paired Student’s t test. (M) Proliferation curves of P7 organoids with p53WT/WT with or without expression of an shRNA targeting Soat1 in complete media or complete media containing 50 µM cholesterol. Results show mean ± SD of five technical replicates. No statistical difference was found, as calculated by unpaired Student’s t test for the last time point. (N) qPCR analysis of Soat1 in P5 organoids with p53R270C/LOH with or without expression of an shRNA targeting Soat1. Results show mean ± SD of two technical replicates. *, P < 0.05, paired Student’s t test. (O) qPCR analysis of Soat1 in P7 organoids with p53R270C/LOH with or without expression of an shRNA targeting Soat1. Results show mean ± SD of two technical replicates. *, P < 0.05, paired Student’s t test. (P) Proliferation curves of P7 organoids with p53R270C/LOH with or without expression of an shRNA targeting Soat1 in complete media or complete media containing 50 µM cholesterol. Results show mean ± SD of five technical replicates. ***, P < 0.001, unpaired Student’s t test calculated for the last time point. (Q) qPCR analysis of Soat1 in T91−/− organoids with or without expression of an shRNA targeting Soat1. Results show mean ± SD of two technical replicates. **, P < 0.01, paired Student’s t test. (R) qPCR analysis of Soat1 in T113−/− organoids with or without expression of an shRNA targeting Soat1. Results show mean ± SD of two technical replicates. **, P < 0.01, paired Student’s t test. (S) Proliferation curves of T113−/− organoids with or without expression of an shRNA targeting Soat1 in complete media or complete media containing 50 µM cholesterol. Results show mean ± SD of five technical replicates. No statistical difference was found, as calculated by unpaired Student’s t test for the last time point. (T) DNA gel showing Trp53 genetic status in T8 organoids and in DAPI− CD45− CD31− PDPN− EpCAM+ epithelial cancer cells sorted from T8 OGO models. mut, mutant. (U) Representative IHC of p53 in T8 OGO models (n = 2). Insert: magnification. Scale bar, 200 µm. (V) qPCR analysis of Soat1 in T8 organoids with or without expression of an shRNA targeting Soat1. Results show mean ± SD of two technical replicates. *, P < 0.05, paired Student’s t test. (W) Western blot analysis of SOAT1 in T8 organoids with or without expression of an shRNA targeting Soat1 (n = 2). HSP90, loading control. Molecular weights in kilodaltons. (X) Proliferation curves of T8 organoids with or without expression of an shRNA targeting Soat1 in complete media or complete media containing 50 µM cholesterol. Results show mean ± SD of five technical replicates. No statistical difference was found, as calculated by unpaired Student’s t test for the last time point.

