Figure 5.
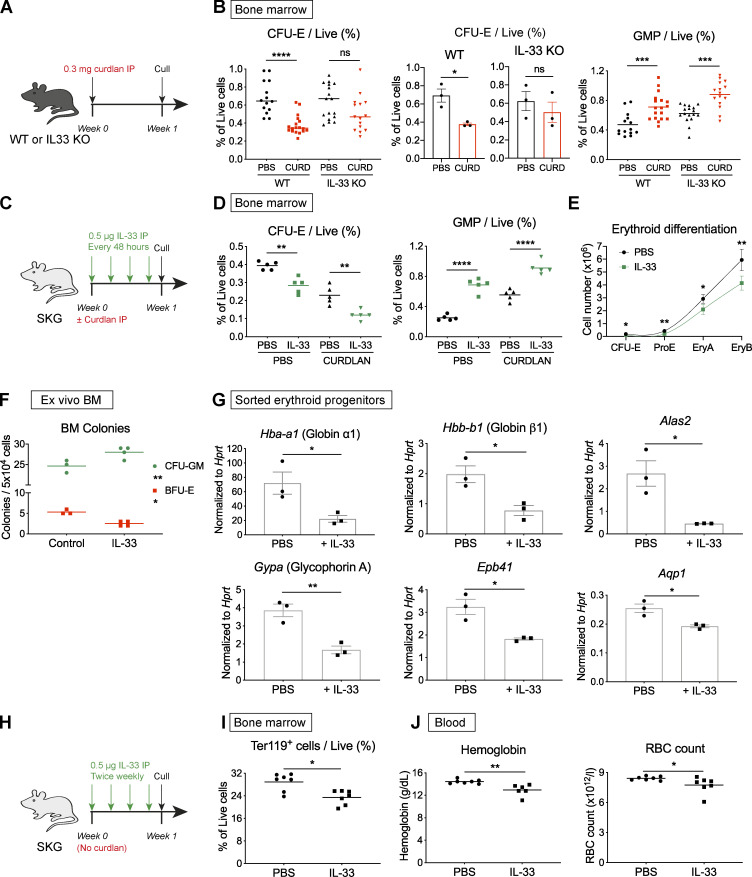
IL-33 is implicated in suppression of erythropoiesis during chronic inflammation. (A) Schematic diagram showing injection of curdlan (CURD) or PBS in IL-33−/− mice backcrossed for eight generations onto same C57BL/6 colony from which WT control mice derived, before culling after 1 wk to obtain data shown in B. (B) Frequency of CFU-E (left, middle) and GMP (right) among live BM cells. For CFU-Es, results are presented as pooled values from three independent experiments (left; points show individual mice with mean, one-way ANOVA with Tukey’s test) or as a summary of the same three independent experiments (middle) with mean and SEM (n = four to six mice per group per experiment, unpaired t test). For GMP, points show individual mice with mean pooled from three independent experiments. Groups compared by one-way ANOVA with Tukey’s test. (C) Schematic diagram showing injection of SKG mice with recombinant murine IL-33, after injection of PBS or curdlan in littermate controls, before culling after 1 wk to obtain data shown in D, E, and G. (D) Frequency of indicated progenitors among live BM cells (points show individual mice with mean, one-way ANOVA with Tukey’s test, representative of three independent experiments). (E) Erythroid differentiation pathway (mean and SD for n = five to six mice per group with locally weighted scatterplot smoothing (LOWESS) spline, Mann-Whitney U test, representative of three independent experiments). (F) Frequency of indicated colonies from whole BM from healthy SKG mice in methylcellulose medium ±IL-33 after 10 d (mean and SD from n = three to four mice per group, two-way ANOVA with Sidak’s multiple comparison test, representative of two independent experiments). (G) Gene expression by RT-qPCR in FACS-sorted pre–CFU-Es from BM of healthy SKG mice and littermate controls injected with IL-33 (mean and SEM of n = three independent experiments, n = two mice per group per experiment, unpaired t test). (H) Schematic diagram showing injection of SKG mice with IL-33 or PBS in littermate controls over 4 wk to obtain data shown in I and J. (I) Frequency of erythroid (Ter119+) cells among live BM cells (points show individual mice with mean, Mann-Whitney U test, representative of two independent experiments). (J) Blood Hgb concentration (left) and RBC count (right). Points show individual mice with mean, Mann-Whitney U test, representative of two independent experiments. *, P < 0.05; **, P < 0.01; ***, P < 0.001; ****, P < 0.0001.

