Figure S5.
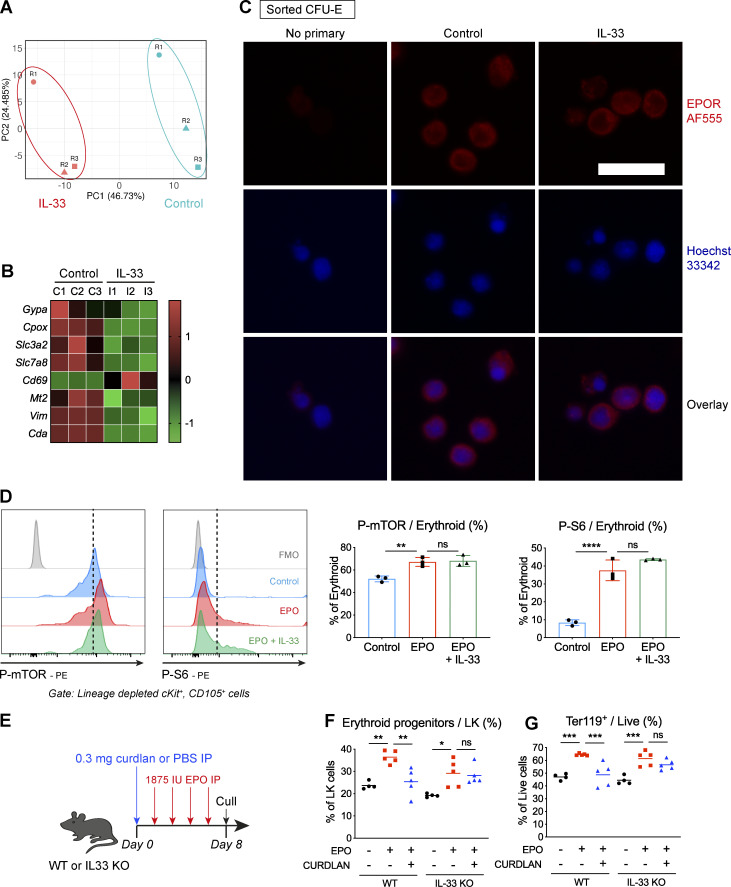
IL-33 decreases expression of genes required for terminal erythroid maturation. (A) Plot of principal components (PCs) showing clustering of control and IL-33–treated samples from n = three independent experiments (labeled R1–R3) based on differential gene expression from RNA sequencing analysis described in Fig. 6 A. (B) Heatmap showing differential expression of selected genes required for terminal erythroid differentiation in pre–CFU-Es by RNA sequencing, expressed as row-normalized z scores. Columns represent paired biological replicates from n = three independent experiments. (C) Representative fluorescence images of FACS sorted CFU-Es incubated with IL-33 or medium for 12 h and then stained for EPO-R and Hoechst nuclear stain. Bottom row shows overlay of single-color images. Scale bar = 25 µm. Representative of two independent experiments. (D) Representative images showing flow cytometric expression of indicated phosphorylated proteins in erythroid progenitors exposed to medium or IL-33 and then stimulated with EPO. Graphs show proportion of erythroid progenitors expressing indicated phosphorylated proteins. Points represent technical triplicates, and bars represent mean and SD; one-way ANOVA with Tukey’s test, representative of two independent experiments. mTOR, mammalian target of rapamycin. (E) Schematic diagram showing WT or IL33−/− mice injected with curdlan or PBS, then injected four times with EPO IP as indicated before culling to produce data shown in F and G. IL-33−/− mice were backcrossed for eight generations onto the same colony of WT mice from which controls were used. (F) Frequency of CD105+ erythroid progenitors (i.e., CFU-Es and pre–CFU-Es) among lineagenegcKit+Sca1neg cells in BM. Points represent individual mice, lines represent mean. Groups were compared by one-way ANOVA with Tukey’s test, representative of two independent experiments. (G) Frequency of Ter119+ cells among live BM. Points represent individual mice, and lines represent mean. Groups were compared by one-way ANOVA with Tukey’s test; representative of two independent experiments. *, P < 0.05; **, P < 0.01; ***, P < 0.001; ****, P < 0.0001.

