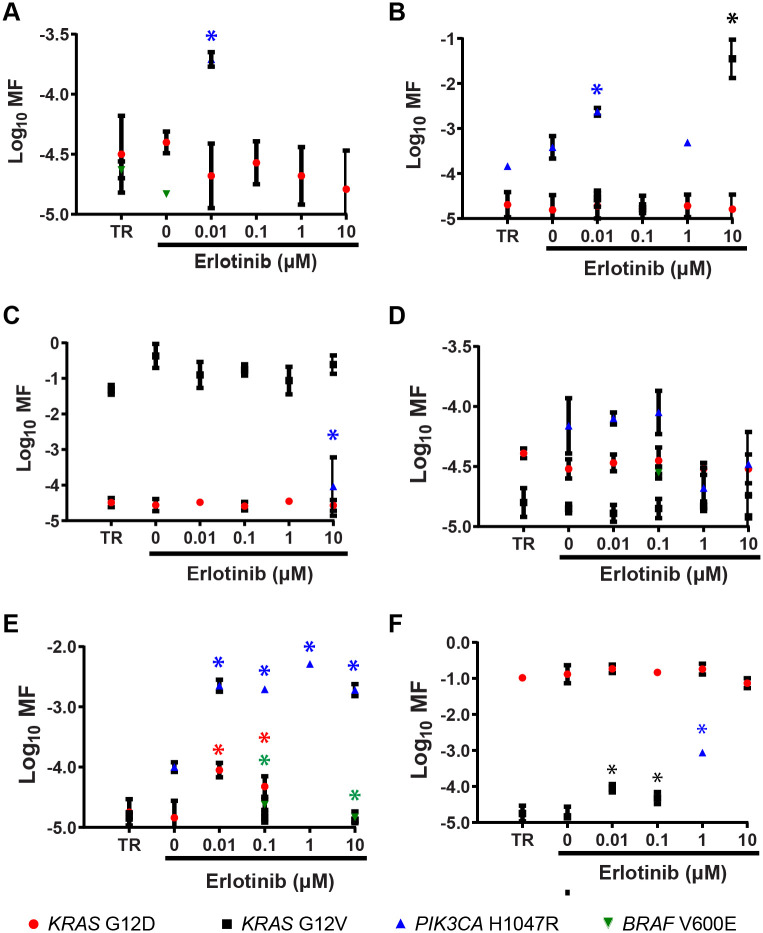
Fig 8. Quantification of mutant subpopulations in DNA harvested from short-term spheroid cultures.
Six of the cultures derived from the ten tumors are shown: (A) Tumor 2, (B) Tumor 3, (C) Tumor 4, (D) Tumor 5, (E) Tumor 7, and (F) Tumor 9. Asterisks denote MF measurements significantly greater than that of both TR and the corresponding 0 μM erlotinib culture (one-sided Mann Whitney test, P = 0.0500).

