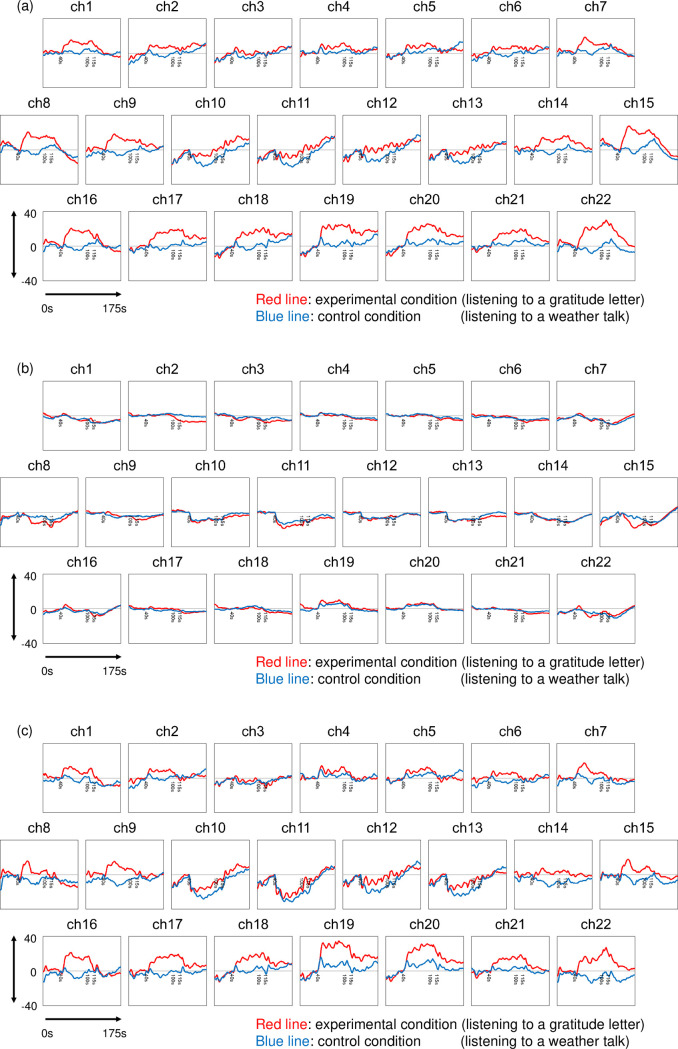
Fig 5.
Waveforms of average changes in (a) oxy-Hb, (b) deoxy-Hb, and (c) total Hb under experimental condition (red line) and under control condition (blue line) in 22 channels measured by NIRS (n = 20). The vertical axis shows the relative changes in oxy-Hb, deoxy-Hb, and total Hb (×10−3), ranges from -40 to 40. The horizontal axis shows the time course of the activation task, through the baseline period (0–40 s), listening period (40–100 s), response period (100–115 s), and rest period (115–175 s). The data were averaged and summed in reference to the zero-onset (shown as 40 s in the figure, just between the baseline period and listening period). In channel 4, n = 18.

