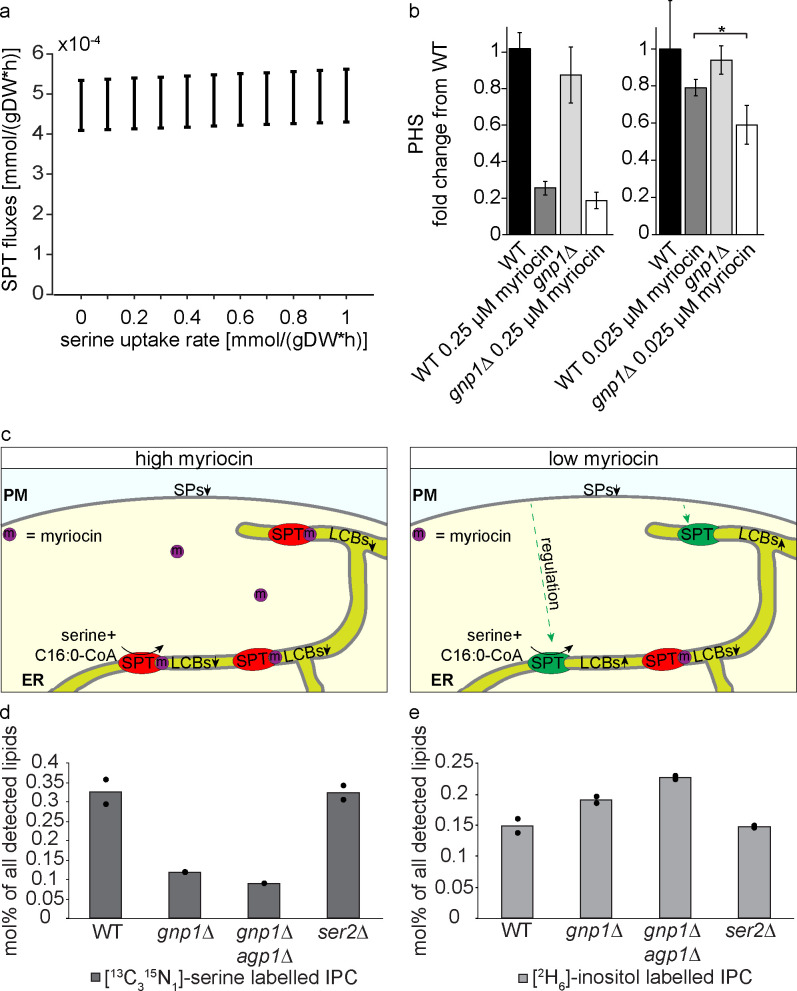
Fig 6. Imported serine is the main source for SP biosynthesis.
(a). Predicted flux of SPT at varying serine uptake rates in YPD medium. Variability of flux through SPT at varying serine uptake rates, as predicted by FVA. Positive and negative fluxes correspond to serine production and consumption, respectively. SPT fluxes and serine uptake rates are represented in mmol per gram dry weight per hour. (b) GNP1 is essential to maintain SP homeostasis. Mass spectrometric analysis of phytosphingosine (PHS) concentrations in WT and gnp1Δ cells grown in the presence or absence of 0.25 μM myriocin or 0.025 μM myriocin in YPD medium. Error bars represent standard deviations. n = 3. *, P-value <0.05, calculated from t-test. (c) Model of SPT activity under high and low concentrations of myriocin. Under high concentrations of myriocin (left panel) most SPT complexes are inhibited by myriocin and de novo SP biosynthesis is significantly impaired resulting in decreased SP concentrations. Under low concentrations of myriocin (right panel), only few SPT complexes are inhibited by the suicide inhibitor myriocin while the cell regulates against the decreasing SP levels resulting in the upregulation of the remaining SPT molecules and constant SP concentrations. (d) Integration of [13C315N1]-serine into inositol-phosphorylceramides (IPC). Cells were labelled with [13C315N1]-serine and [2H6]-inositol over 90 minutes in YPD medium. Lipids were extracted and analyzed via mass spectrometry. Displayed are the amounts of [13C315N1]-serine labelled IPCs of WT cells, gnp1Δ cells, gnp1Δagp1Δ cells and ser2Δ cells in mol% per all detected lipids. The average is displayed in bars. Dots correspond to the values of two independent experiments. (e) Integration of [2H6]-inositol into IPCs. Displayed are the amounts of [2H6]-inositol labelled IPCs of WT cells, gnp1Δ cells, gnp1Δagp1Δ cells and ser2Δ cells in mol% per all detected lipids. The average is displayed in bars. Dots correspond to the values of two independent experiments.

