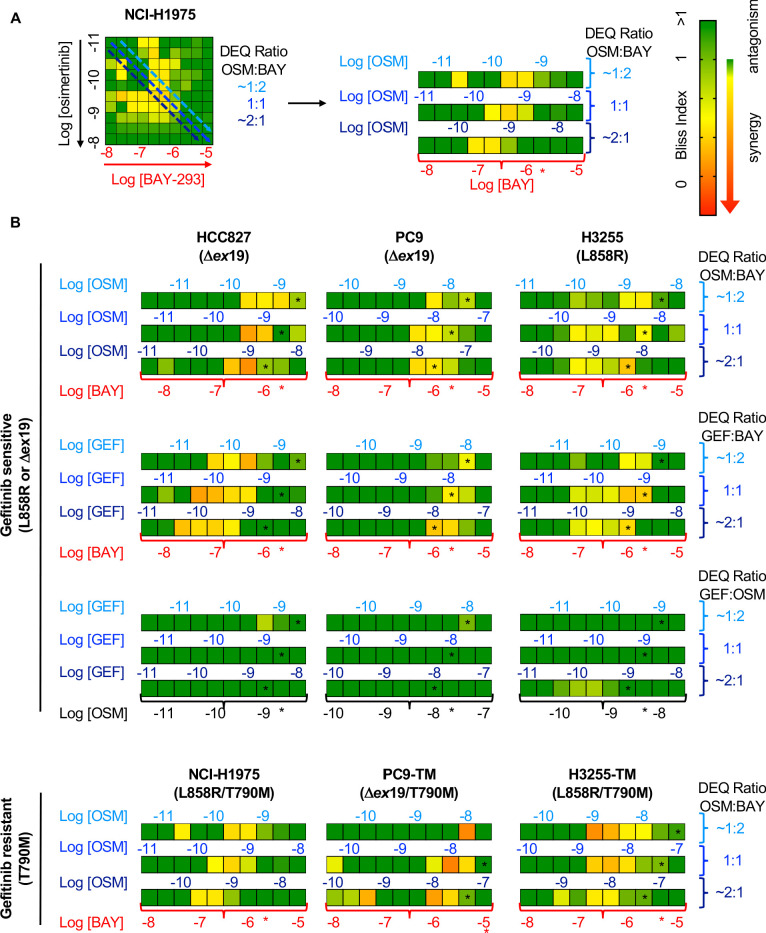
Figure 4. Bliss Independence analysis showing that SOS1 inhibition synergizes with EGFR-TKI treatment to inhibit survival in multiple EGFR-mutated NSCLC cell lines.
(A) Bliss Index heatmap from 3D spheroid cultured NCI-H1975 cells Figure 2A (left) and horizontal projections of Bliss Indices of drug treatments at 2:1, 1:1, and 1:2 ratios of osimertinib:BAY-293 based on dose equivalencies (right). Increasingly synergistic interactions (Bliss index <0.85) are indicated by the corresponding heat map. The concentration of BAY-293 (held constant, bottom) and of osimertinib (above each horizontal projection) are given. The IC50 for each individual drug are shown (*). (B) Bliss Index heatmaps based on A for the indicated gefitinib-sensitive and gefitinib-resistant cell lines at 2:1, 1:1, and 1:2 ratios of osimertinib, gefitinib, and BAY-293 based on dose equivalencies. Data for NCI-H1975 cells are the same as in A. Data are presented as the mean from three independent experiments. For each experiment, three technical replicates were assessed.

