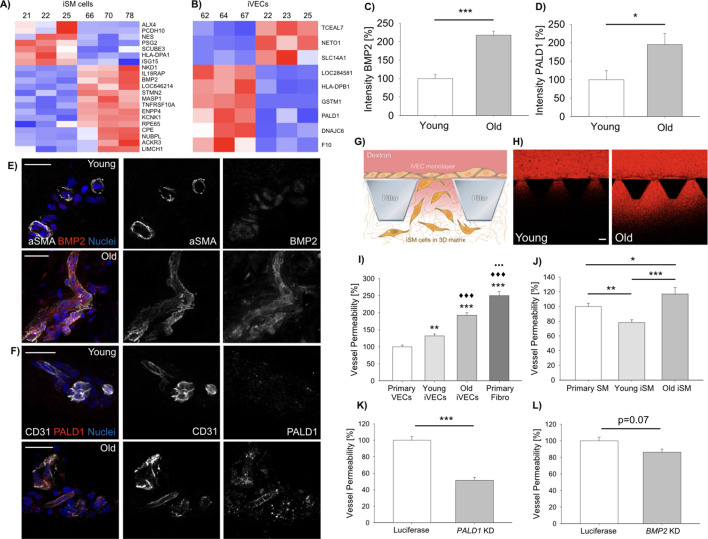
Figure 2. Vascular cells reprogrammed from young vs. old donors show gene expression and functional differences.
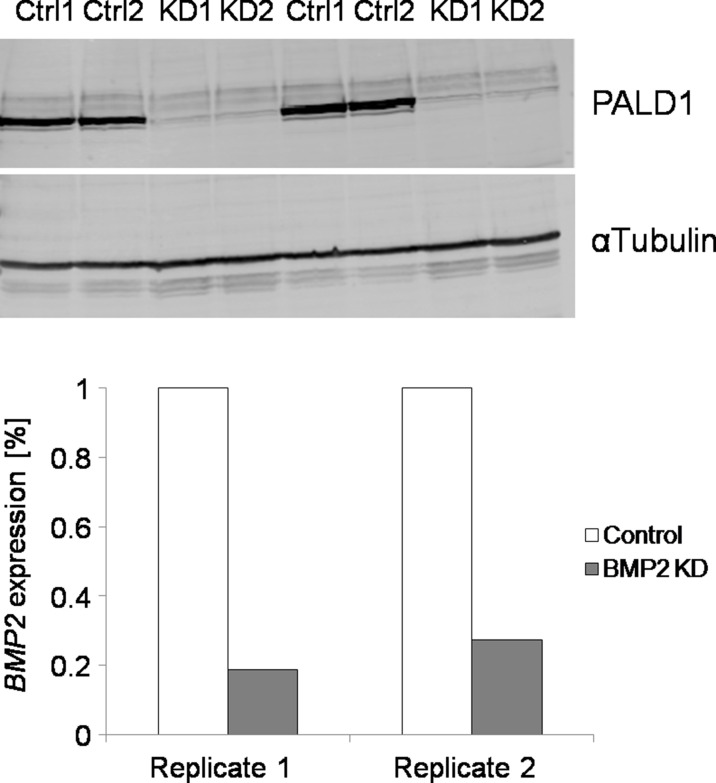
Heat-map representing DE genes between reprogrammed vascular cells from young (N = 3) vs. old (N = 3) donors (iSMCs (A), iVECs (B)). Z score = ± 1.5. DE genes with log2FC > 1 and FDR < 0.05. Quantification of BMP2 (C) and PALD1 (D) expression in human skin biopsies from young vs. old donors (N = 2 donors per condition; N = 10 tissue sections per condition; Student’s t-test with p<0.001 (***) and p<0.05 (*)). Representative images of BMP2 (E) and PALD1 (F) from skin biopsies obtained from young vs. old donors. Scale bars: 50 µm. Quantification of vascular permeability using young vs. old reprogrammed cells (G–J). Schematic showing the generation of an endothelial monolayer covering the interface with a 3D matrix embedding SMCs. Vascular permeability was quantified by measuring the variation of 70 kDa dextran fluorescent intensity across the interface (G). Representative images of dextran flow (red) through the endothelial monolayer in presence of young vs. old reprogrammed cells. Scale bar: 100 µm (H). Quantification of vascular permeability in presence of young vs. old iVECs (I, at least N = 40 independent measurements per condition in three biological replicates; ANOVA with Holm-Sidak test; comparison with primary VECs (** is p<0.01 and *** is p<0.001); comparison with young iVECs (♦♦♦is p<0.001); comparison with old iVECs (••• is p<0.001)) or young vs. old iSMCs (J, at least N = 40 independent measurements per condition in three biological replicates; ANOVA with Holm-Sidak test; * is p<0.05, ** is p<0.01 and *** is p<0.001). Quantification of vascular permeability in presence of PALD1 KD (K) or BMP2 KD (L) in primary VECs and SMCs, respectively (at least N = 60 independent measurements per condition in three biological replicates for each KD experiment; Student's t-test; *** is p<0.001).

