. 2020 Sep 8;9:e57732. doi: 10.7554/eLife.57732

Figure 2. Lymphatic endothelial specific deletion of Efnb2 or Ephb4 disrupts endothelial cell-cell junctions in several organs.

(A) Experimental scheme for LEC-specific deletion of Efnb2 and Ephb4 in the remodeling lymphatic vasculature (LV) using the Prox1-CreERT2 line and a single 4-OHT treatment at P12 (arrowhead). Ear skin whole-mount immunofluorescence of 4-week-old Efnb2 and Ephb4 mice using antibodies against VE-cadherin (red) and GFP (green) (shown for Efnb2 mice only) or CLDN5 alone (single channel images). GFP expression demonstrates Cre recombination in lymphatic endothelia. Note disintegration of collecting lymphatic vessels in Efnb2 and Ephb4 mutant mice (arrows). (B) Ultrastructural analysis of the ear vasculature using transmission electron microscopy showing abnormal features of LEC junctions in Efnb2 mutant mice compared to heterozygous littermate: intercellular gaps (asterisks), cell degeneration (arrow) and increased junction overlap (white dotted line). (C,D) Quantification of intercellular gaps and junctional overlap. Data represent mean ± s.e.m., p-value, Two-tailed unpaired Student’s t-test (n = 12 vessels/194 junctions/3 mice (fl/+) or n = 16 vessels/250 junctions/2 mice (fl/fl)). (E) Whole-mount immunofluorescence of the outer surface of the subcapsular sinus (SCS) of the inguinal lymph node of 4-week-old Efnb2 and Ephb4 mice using an antibody against CLDN5. (F) Whole-mount immunofluorescence of P11 mesenteric collecting vessels in Efnb2 and Ephb4 mice using an antibody against CLDN5. Source data for panels (C,D) are provided. Scale bars: 500 μm (A), 100 μm (A single channel images), 1 µm (B), 10 μm (E,F).

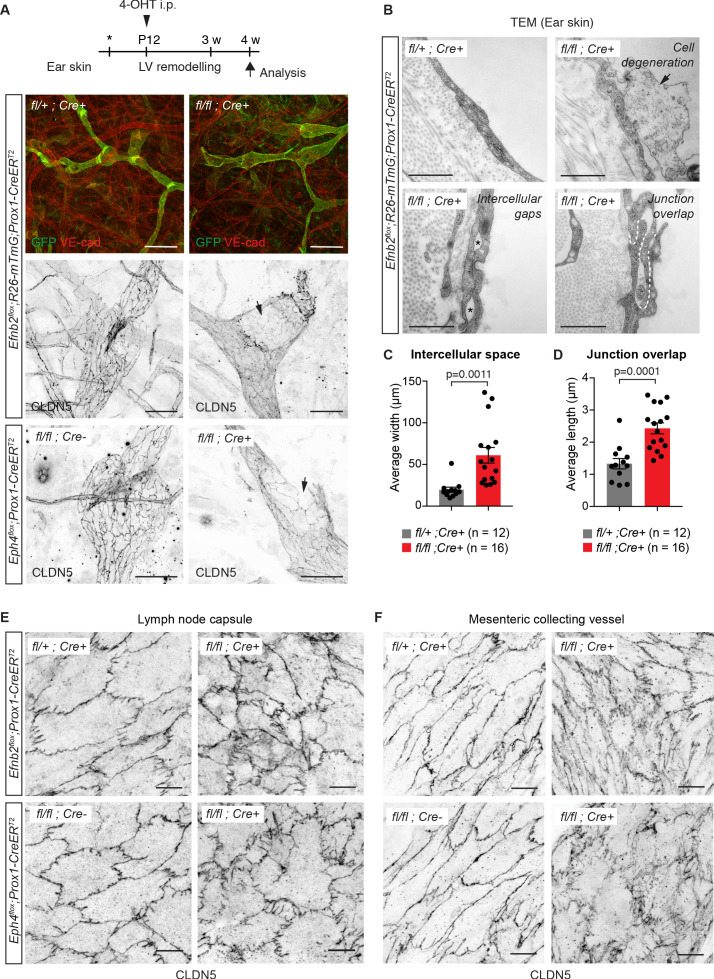
Figure 2—source data 1. Quantification of LEC junction parameters in the skin.

Figure 2.

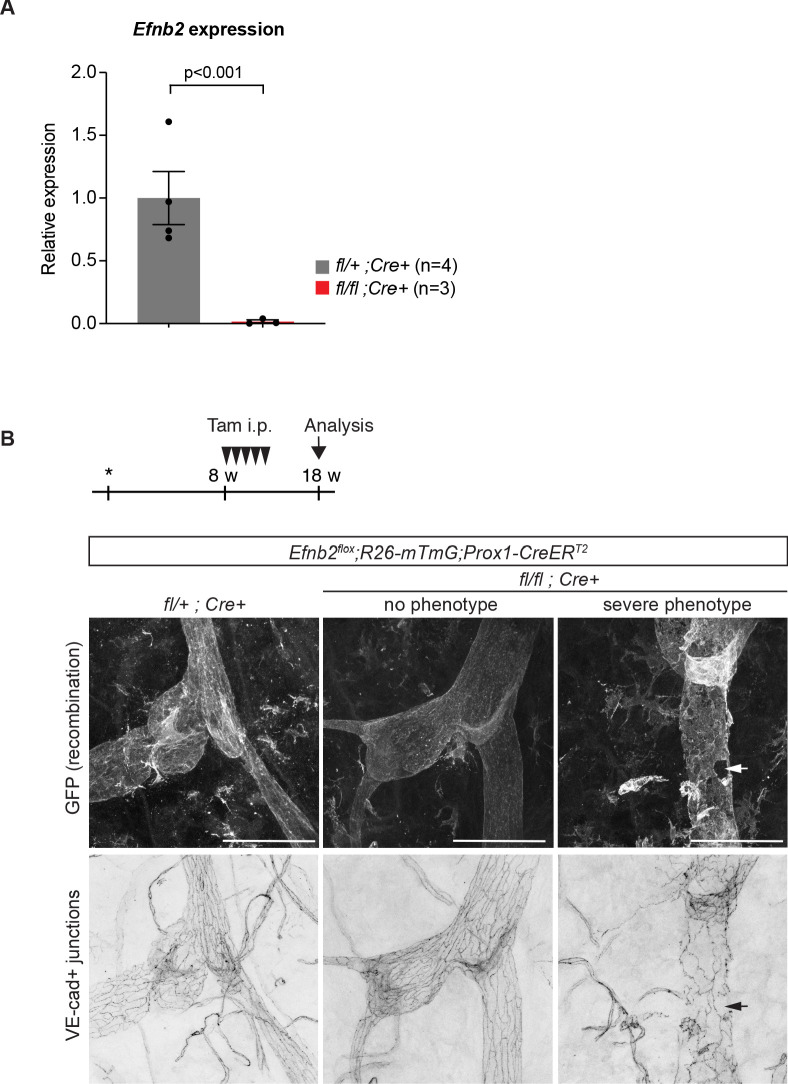
Figure 2—figure supplement 1. Efnb2 deletion in 4-week-old and 18-week-old mice.

Figure 2—figure supplement 1.

(A) Relative mRNA expression levels of Efnb2 in freshly isolated LECs from 4-week-old mutant (n = 3) and heterozygote/wildtype control (n = 4) ear skin. (B) Experimental scheme for LEC-specific deletion of Efnb2 in adult mice. 8-week-old Efnb2flox;Prox1-CreERT2 mice were administered with five consecutive intraperitoneal injections of tamoxifen (arrowheads) and ear skin was analysed at 18 weeks by whole-mount immunofluorescence using antibodies against GFP (upper panel) and VE-cadherin (lower panel). GFP expression demonstrates Cre-mediated recombination in lymphatic endothelial cells. Efnb2 mutants showed variable phenotype, some vessels with apparently normal LEC junctions (no phenotype) and others showing severe disintegration of junctions (severe phenotype). Source data for panel (A) is provided. Scale bar: 100 μm.
Figure 2—figure supplement 1—source data 1. qRT-PCR analysis of Efnb2 expression in FACS sorted dermal LECs.
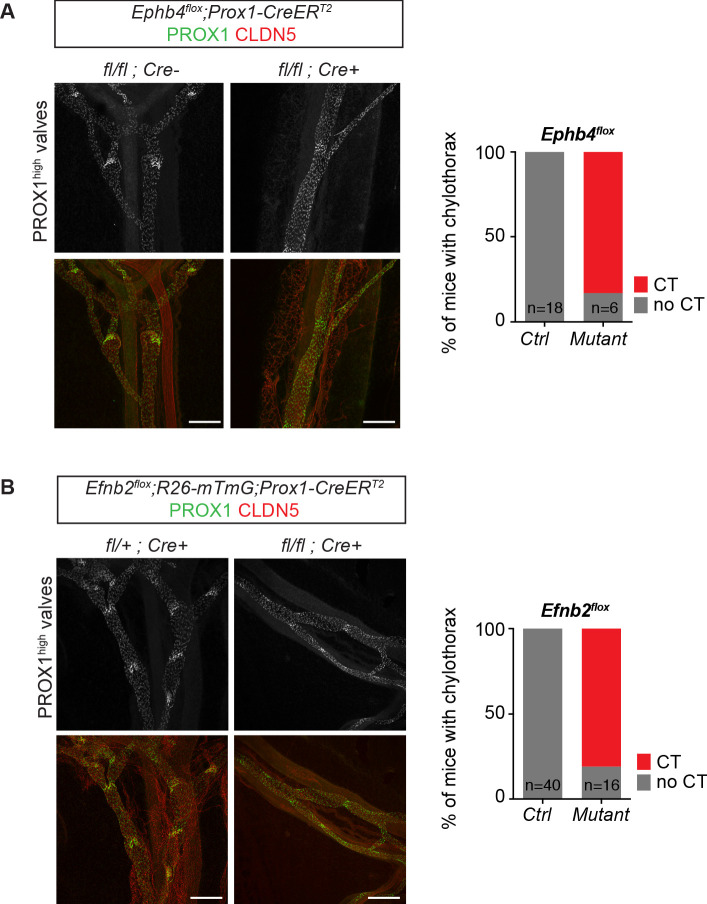
Figure 2—figure supplement 2. Dysfunctional lymphatic valves and chylothorax in Efnb2 and Ephb4 mutant mice.

Figure 2—figure supplement 2.

Whole-mount immunofluorescence of P11 mesenteric collecting vessels (on the left) and incidence of chylotorax (on the right) in Ephb4flox;Prox1-CreERT2 (A) and Efnb2flox;Prox1-CreERT2 (B) mice neonatally (P4) treated with 4-OHT. Lymphatic valves show high PROX1 expression and are malformed in the mutant vessels. n = 18 (control) and n = 6 (mutant) neonatal Ephb4 mice were analyzed from five independent litters. n = 40 (control) and n = 16 (mutant) neonatal Efnb2 mice were analyzed from eight independent litters. Source data for panels (A,B) are provided. Scale bar: 200 μm.
Figure 2—figure supplement 2—source data 1. Incidence of chylothorax in Ephb4 and Efnb2 mutant mice.
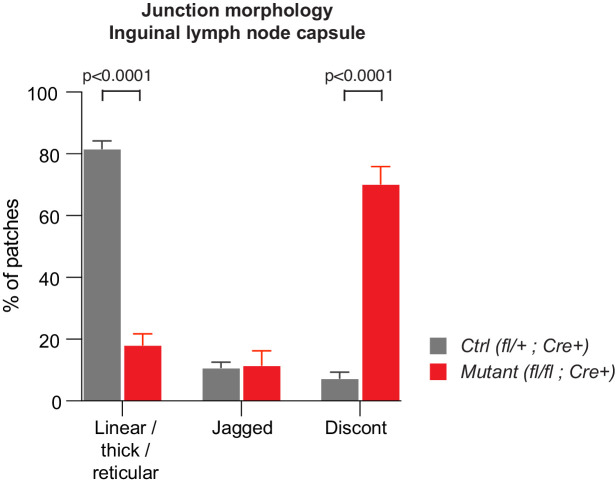
Figure 2—figure supplement 3. Abnormal morphology of LEC junctions in the inguinal lymph node capsule of Efnb2 mutant mice.

Figure 2—figure supplement 3.

Quantification of lymphatic junctional morphology in CLDN5-stained lymph nodes upon Efnb2 deletion. Junctional categories are defined as 1. linear/thick/reticular, 2. jagged and 3. discontinuous junctions. Data represent mean ± s.e.m. adjusted p-value, Multiple t-tests, (n = 150 patches/2 mice per genotype). Source data is provided.
Figure 2—figure supplement 3—source data 1. Quantification of LEC junction morphology in the inguinal lymph node capsule.