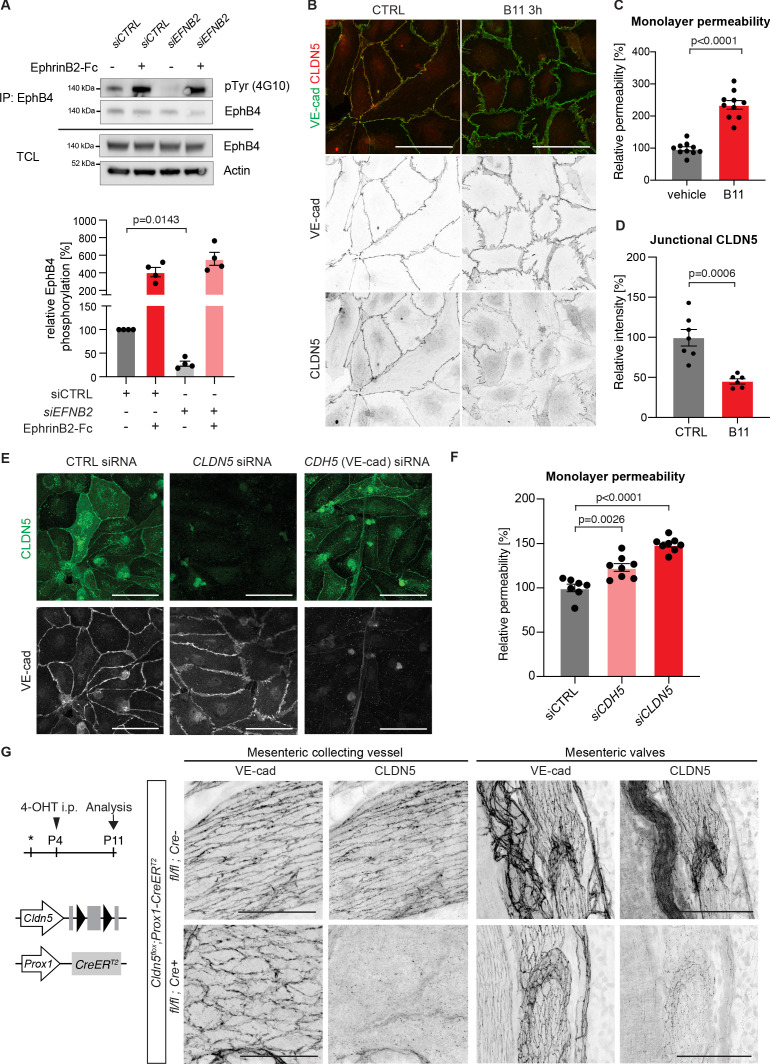
Figure 4. Loss of junctional CLDN5 occurs after EphrinB2 blockade in vitro but does not lead to breakdown of LEC junctions in vivo.
(A) Top: Western blot of EphrinB2-Fc-precipitated EphB4 HDLECs for phosphotyrosine (4G10) and EphB4. Cells were treated with control (siCTRL) or EphrinB2 siRNA (siEFNB2), and stimulated with pre-clustered EphrinB2-Fc or control Fc. Total cell lysates (TCL) were immunoblotted for EphB4 and actin. Bottom: Quantification of relative EphB4 phosphorylation (adjusted to total precipitated EphB4 protein) from four independent experiments, showing EphrinB2-dependent basal EphB4 activity in unstimulated LECs. (B) Immunofluorescence of HDLECs treated with EphrinB2 blocking antibody (B11) for 3 hr using antibodies against VE-cadherin (green) and CLDN5 (red). Single channel images are depicted in grey. EphrinB2 blockade induces junction remodeling and removal of junctional CLDN5. (C) Quantification of HDLEC monolayer permeability to 40 kDa FITC-dextran showing increase upon B11 treatment for 3 hr (n = 10 replicates per condition from three independent experiments). (D) Quantification of junctional CLDN5 immunofluorescence in VE-cadherin+ junctions (n = 6–7 images from three independent experiments). (E) Immunofluorescence of HDLECs transfected with CTRL, CLDN5 or CDH5 (VE-cadherin) siRNA for 48 hr. Staining for CLDN5 (green) and VE-cadherin (grey) show disruption of VE-cadherin+ junctions upon CLDN5 siRNA transfection. Note, CLDN5+ junctions are not affected upon VE-cadherin silencing. (F) Quantification of HDLEC monolayer permeability to 40 kDa FITC-dextran showing minor and moderate increase upon CDH5 or CLDN5 silencing, respectively (n = 7–8 replicates per condition from two independent experiments). (G) Whole-mount immunofluorescence of mesenteric collecting vessels and valves in P11 Cldn5flox;Prox1-CreERT2 mice using antibodies against CLDN5 and VE-cadherin. Note efficient CLDN5 depletion apart from a few CLDN5 hot spots and altered morphology but no disintegration of the junctions. Data in A represent mean ± s.e.m. p value, One-sample t-test. Data in C, D, F represent mean ± s.e.m. p value, Two-tailed unpaired Student’s t-test. Source data for panels (A,C,D,F) are provided. Scale bars: 100 μm (B, E, G mesenteric valves), 50 μm (G mesenteric collecting vessel).
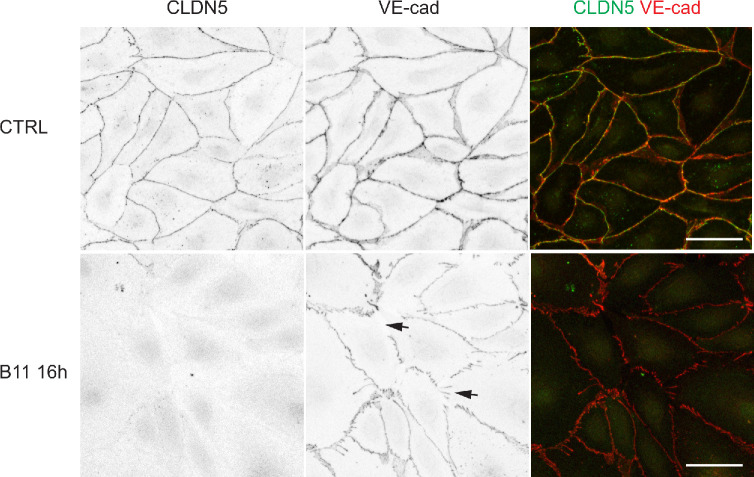
Figure 4—figure supplement 1. Loss of junctional CLDN5 after long-term EphrinB2 inhibition in primary LECs.
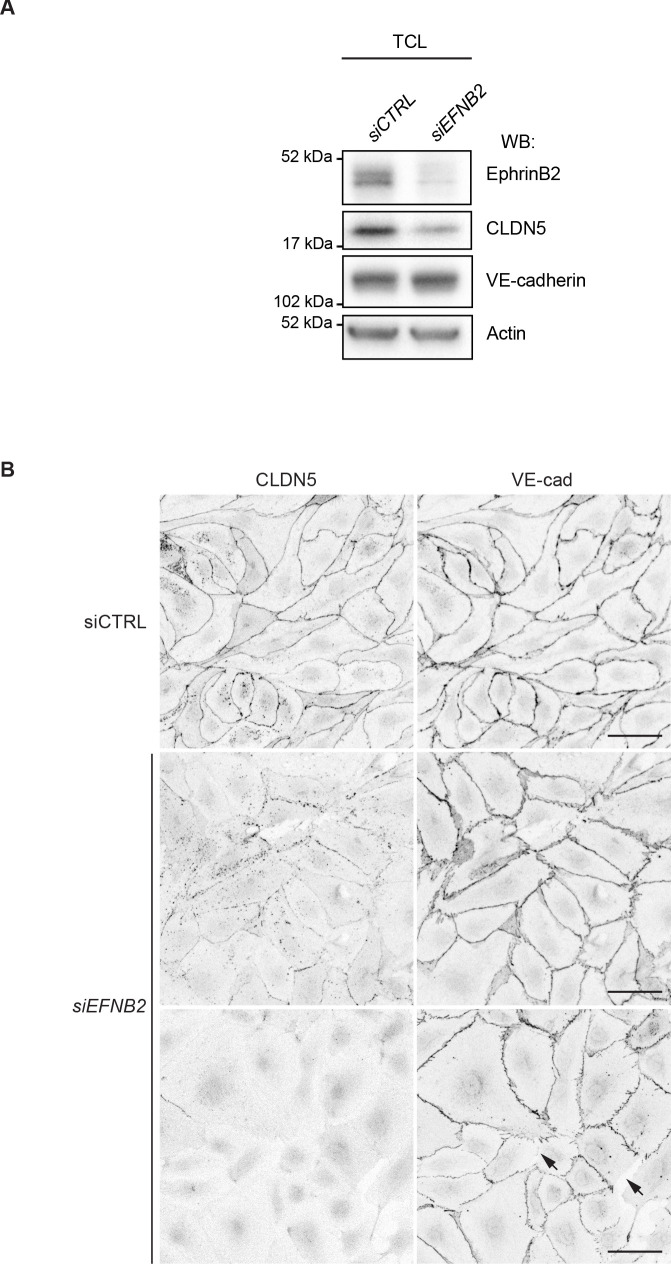
Figure 4—figure supplement 2. The effect EFNB2 silencing on CLDN5 and VE-cadherin.
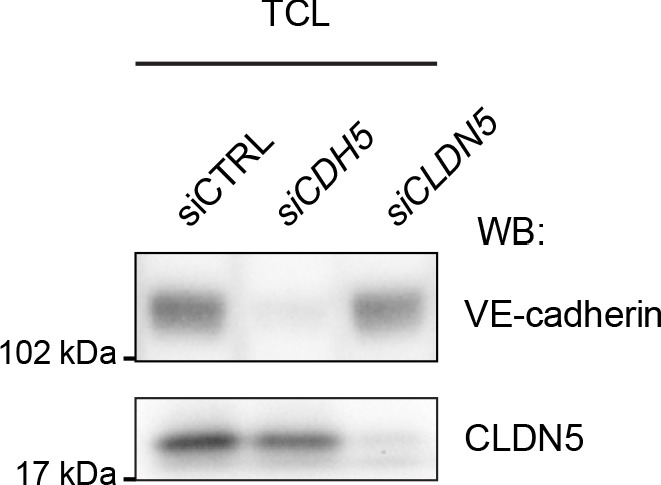
Figure 4—figure supplement 3. Silencing of CDH5 and CLDN5 in HDLECs.
