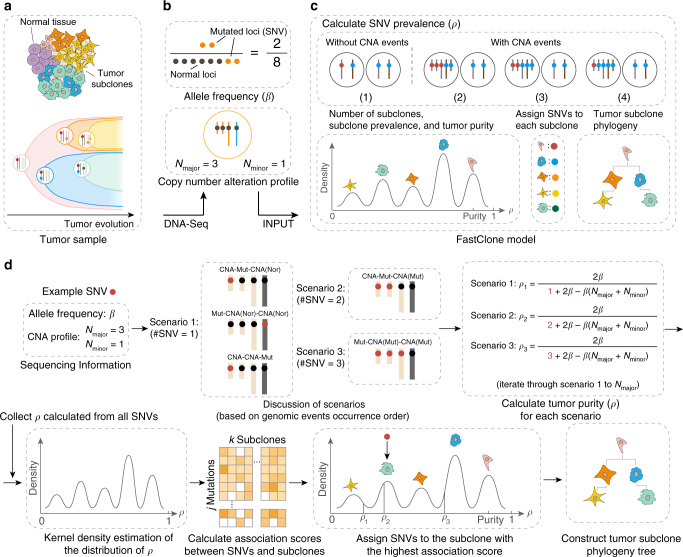
Fig. 1. Overview of the FastClone algorithm.
a The tumor sample is heterogeneous, composed of both normal cells and tumor subclones (top panel). The tumor dynamically evolves throughout the disease course, generating subclones with different genotypes (bottom panel). The dots in different colors represent different SNVs. b DNA-sequencing of the bulk tumor provides information about (1) allele frequency of each SNV (β), that is, the observed allele occurrence among all cells (top panel); (2) a CNA profile in the form of Nmajor and Nminor (bottom panel). Each of the yellow dots represents a copy of the allele with a certain SNV. c FastClone model. First, we calculated the proportion of cells that carry each SNV (ρi for SNVi). This calculation is discussed in two situations: with and without CNA events. Multiple possibilities are further discussed (see Fig. 2). Blue spheres represent normal loci, and red spheres represent mutated loci that contain SNVs. Then, subclone numbers, subclone proportions, and tumor purity are determined from the distribution of ρ. After that, SNVs are assigned to subclones. Finally, the putative evolutionary relationship of the subclones is established. d The workflow of FastClone algorithm. The workflow starts with sequencing information as input, which includes allele frequency (β) and CNA profile (Nmajor and Nminor). Since we do not know the order of occurrence of genomic events, all possible scenarios are discussed, and ρ value for each scenario is calculated separately. The number of possible scenarios equals the value of Nmajor. Then, KDE is used to determine the distribution of ρ. Each peak in the ρ distribution indicates a subclone. After that, association scores between each SNV–subclone pair are calculated. Then, the SNV is assigned to the subclone with the highest association score. If there are several ρ values associated with one SNV, then the ρ that provides the highest association score is used to assign the SNV to the subclone (in this case, ρ2 that assigns this SNV to the green subclone is considered the correct solution). Finally, the most likely phylogeny tree of the subclones is constructed.

