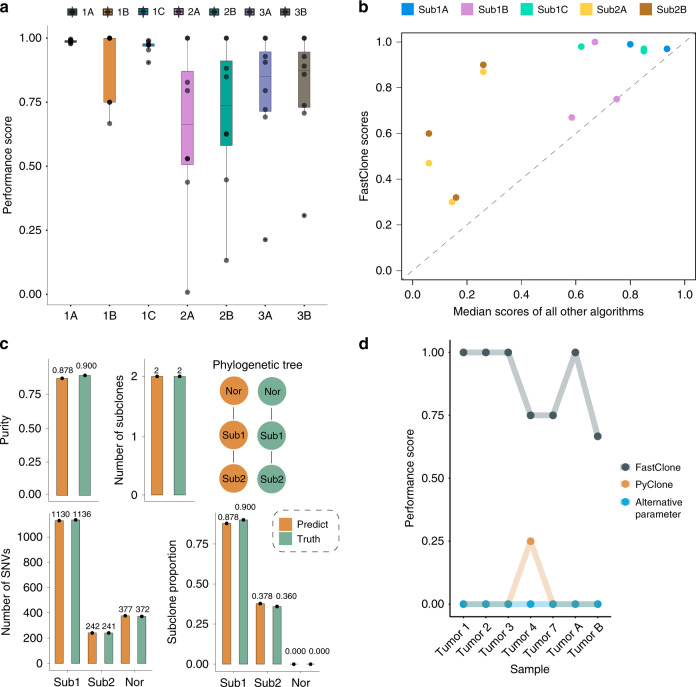
Fig. 3. FastClone’s performance on simulated data in DREAM challenge.
a Evaluation of prediction accuracy for 1A. Tumor purity, 1B. Number of subclones, 1C. Proportion of each subclone, 2A. Binary assignment of SNVs, 2B. Confusion matrix of co-occurrence of two SNVs in a subclone, 3A. Phylogeny tree, 3B. Tree relationship of individual SNVs. In the boxplots, black dots refer to each tumor sample, center lines refer to median performance, bounds of box refer to the first quartile and the third quartile of the data, and whiskers refer to min and max of the data. b Comparison of FastClone performance with other algorithms. Median scores of other algorithms are calculated from all entries of other teams on the leaderboard of each sub-challenge. Sub3A and Sub3B are not included in this comparison because there are no other entries on the leaderboard. c Example of inferred tumor heterogeneity versus ground truth. “Sub” refers to subclones and “Nor” refers to normal cell infusion. d The performance scores of FastClone and PyClone on predicting subclone numbers.

