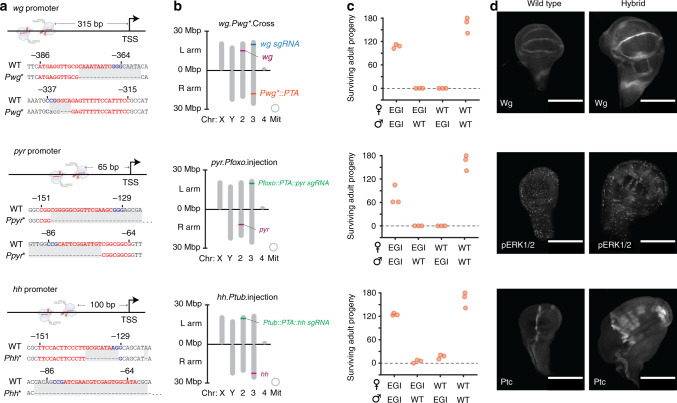
Fig. 3. Genotype and hybrid incompatibility of select EGI strains.
a Proximity of sgRNA-binding sites to transcription start site (TSS) for EGI strains. Sequences of both sgRNA-binding sites are shown below promoter illustration, with protospacers in red and protospacer adjacent motifs in blue. Sequences of the mutated promoters at the sgRNA-binding loci are shown below with differences highlighted in gray shadow. b Chromosomal locations of genome alterations. Violet text represents target genes, orange text represents PTA-constructs, blue text represents sgRNA constructs, and green text represents joint PTA-sgRNA constructs. c Hybrid incompatibility data showing number of progeny surviving to adulthood. Genotype of parental strains for each cross are given on the x-axis. n = 3 biologically independent experiments. d Immunohistochemical staining of wild-type (left) or hybrid (right) larva showing over or ectopic expression of targeted signaling pathways. Antibody binding targets are labeled in the bottom left corner of each image. For each panel, the wg-, pyr-, and hh-targeting EGI genotypes are shown from top to bottom. 200 µM scale bar. Images are representative of at least six independent biological samples for each strain.

