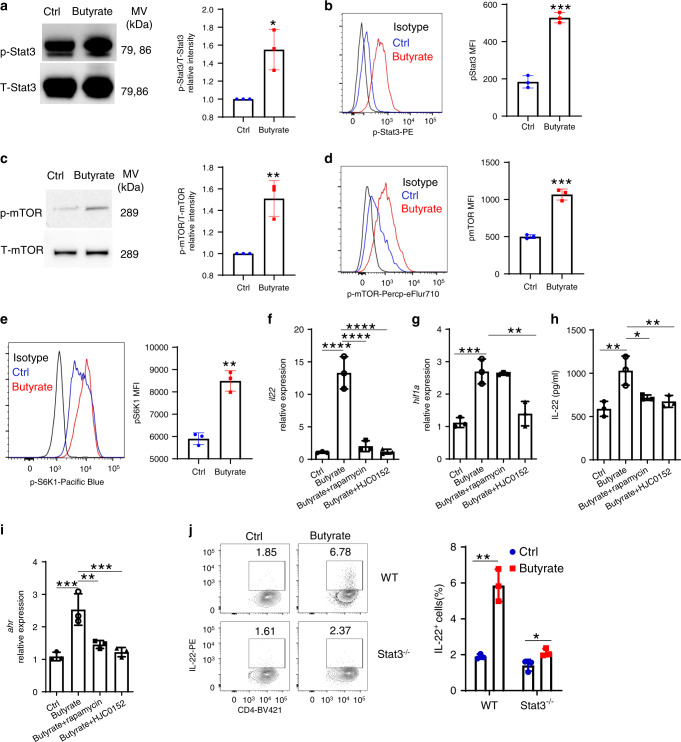
Fig. 5. Stat3 and mTOR regulate IL-22 production by CD4+ T cells.
a–d WT CD4+ T cells were activated with anti-CD3/CD28 mAbs under Th1 conditions with or without butyrate (0.5 mM) (n = 3/group). Phosphorylated Stat3 (6 h) (a, b) and phosphorylated mTOR (24 h) (c, d) were assessed by western blot and flow cytometry. Phosphorylated S6K was analyzed by flow cytometry (e). f–i CBir1 Tg CD4+ T cells were activated with APCs and CBir1 peptide under Th1 conditions with butyrate (0.5 mM) ± rapamycin (1 µM) or HJC0152 (1 µM). IL-22 mRNA (f) and protein (g) were assessed by qRT-PCR and ELISA at 60 h (n = 3/group). Expression of Hif1a (h) and Ahr (i) was analyzed at 48 h by qRT-PCR. j WT and Stat3−/− CD4+ T cells were treated with or without butyrate (0.5 mM) for 5 days (n = 3/group). IL-22 production was measured by flow cytometry. One representative of three independent experiments was shown. Data were expressed as mean ± SD. Statistical significance was tested by two-tailed unpaired Student t-test (a–e, j) or two-tailed one-way ANOVA (f–i). a *p = 0.0134; b ***p = 0.0002; c **p = 0.0059; d ***p = 0.0002; e **p = 0.0010; f, ****p < 0.0001; g **p = 0.0019 (butyrate vs control) and 0.0069 (butyrate + rapamycin vs butyrate), *p = 0.0141; h ***p = 0.0004, **p = 0.0012; i, ***p = 0.0004 (butyrate vs control) and 0.009 (butyrate + HJC0152 vs butyrate), **p = 0.0030; j **p = 0.0017, *p = 0.0338.

