Fig. 3.

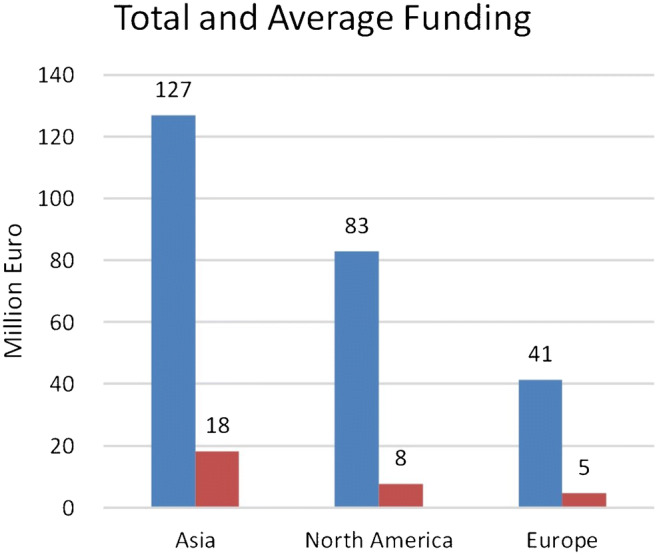
Geographical distribution of acquired funding of 13 of the 27 companies summed and averaged. The amounts in the national currencies have been converted to Euro. The average funding is calculated for all companies in each continent

Geographical distribution of acquired funding of 13 of the 27 companies summed and averaged. The amounts in the national currencies have been converted to Euro. The average funding is calculated for all companies in each continent