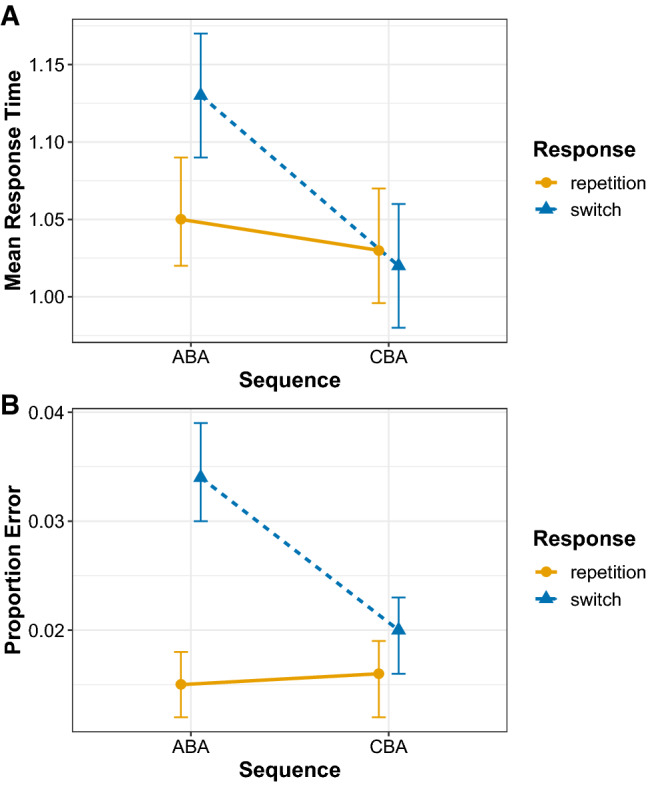
Fig. 18.

Population-level (i.e. fixed-effect) predictions from the best-fitting Bayesian multilevel model for response times (a) and proportion error (b) for the 2.5 SD trimming supplementary analysis. Error bars denote 95% Bayesian credible intervals around the mean estimates
