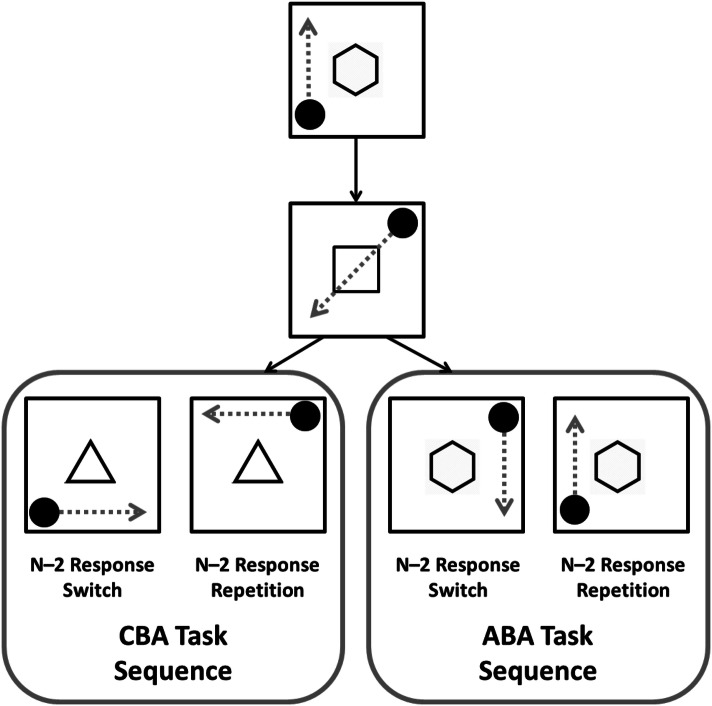
Fig. 2.
Schematic of the experimental paradigm. The arrows represent the spatial transformation required on each trial; these were not shown to participants. Time runs from the top to bottom of figure. Note that the image is not drawn to scale.
Figure available at https://www.flickr.com/photos/150716232@N04/shares/5413G0underCClicencehttps://creativecommons.org/licenses/by/2.0/

