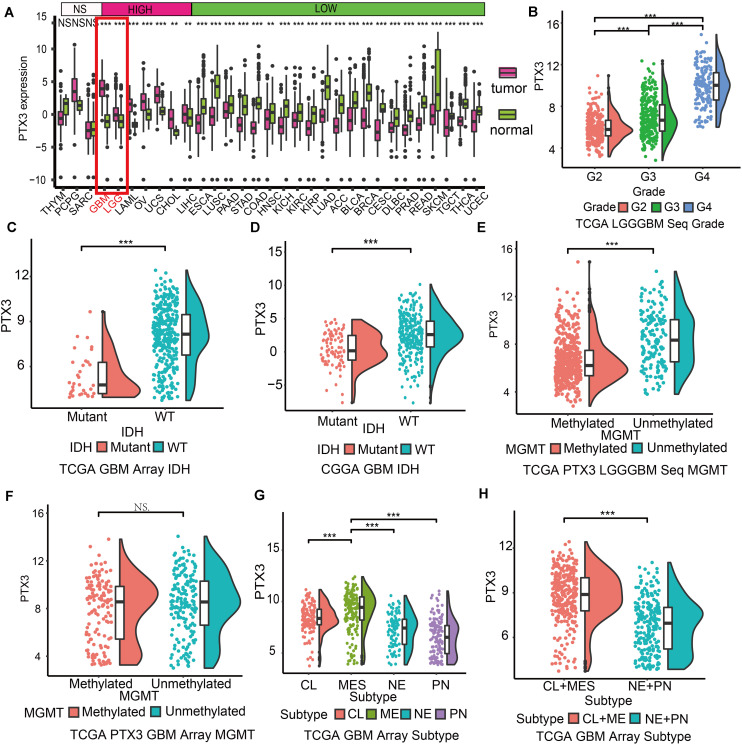
FIGURE 1.
Expression profile of PTX3 in glioma. (A) Expression profile of PTX3 in different tumor cased on TCGA and normal tissue from the Getx database. (B) Sequence data of PTX3 mRNA levels in WHO II, III, and IV from the TCGA dataset. PTX3 expression is related to the status of IDH in GBM from the TCGA microarray dataset (C, P-value < 0.001) and the CGGA dataset (D, P-value < 0.001). PTX3 expression is significant elevated in MGMT unmethylated group than MGMT methylated group in glioma (E, P < 0.001) from the TCGA sequence dataset, while similar difference is not observed in GBM (F, array, P < 0.001) from the TCGA array dataset. (G,H) PTX3 expression profiles in GBM subtypes from the TCGA microarray dataset. MES, mesenchymal; PN, proneural; NE, neural; CL, classical. NS, no significantly statistical; *P < 0.05; **P < 0.01; ***P < 0.001.

