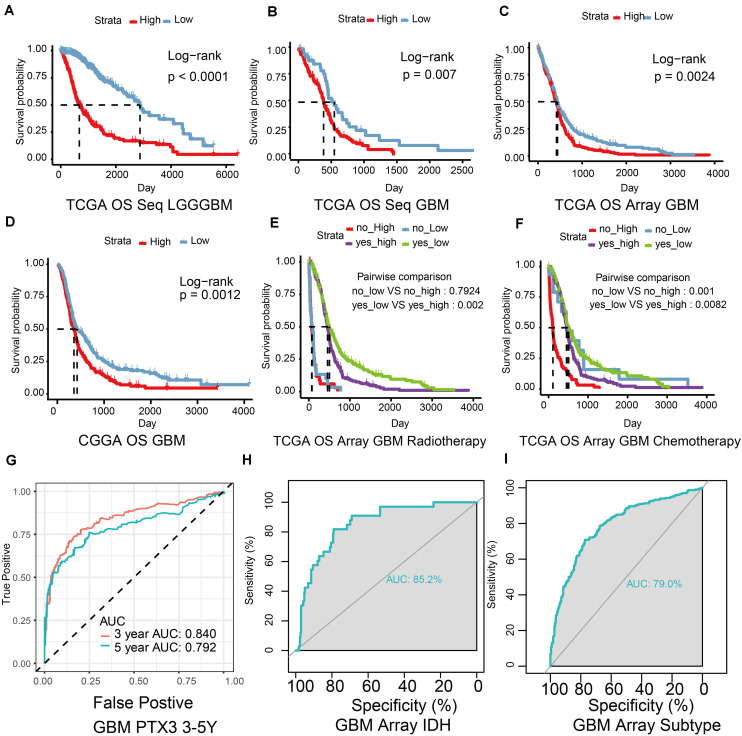
FIGURE 2.
The ability of PTX3 to predict survival outcome. (A) The OS survival probability (P-value < 0.001) was calculated by the Kaplan–Meier survival analysis in glioma with high or low PTX3 expression from the TCGA sequence dataset. The OS in GBM from the TCGA sequence dataset (B, P = 0.007), the TCGA microarray database (C, P = 0.0024), the CGGA dataset (D, P = 0.0012). The survival outcome difference based on the expression of PTX3 in GBM based on the TCGA microarray database when taking radio- (E) or chemo-therapy (F) into consideration. (G) ROC curve of 3 (AUC is 0.840) and 5 years (AUC is 0.792) survive probability based on PTX3 expression in GBM from the TCGA sequence database. ROC curve of PTX3 expression based on the status of IDH (H, AUC = 0.852) and subtypes of GBM (I, AUC = 0.790).

