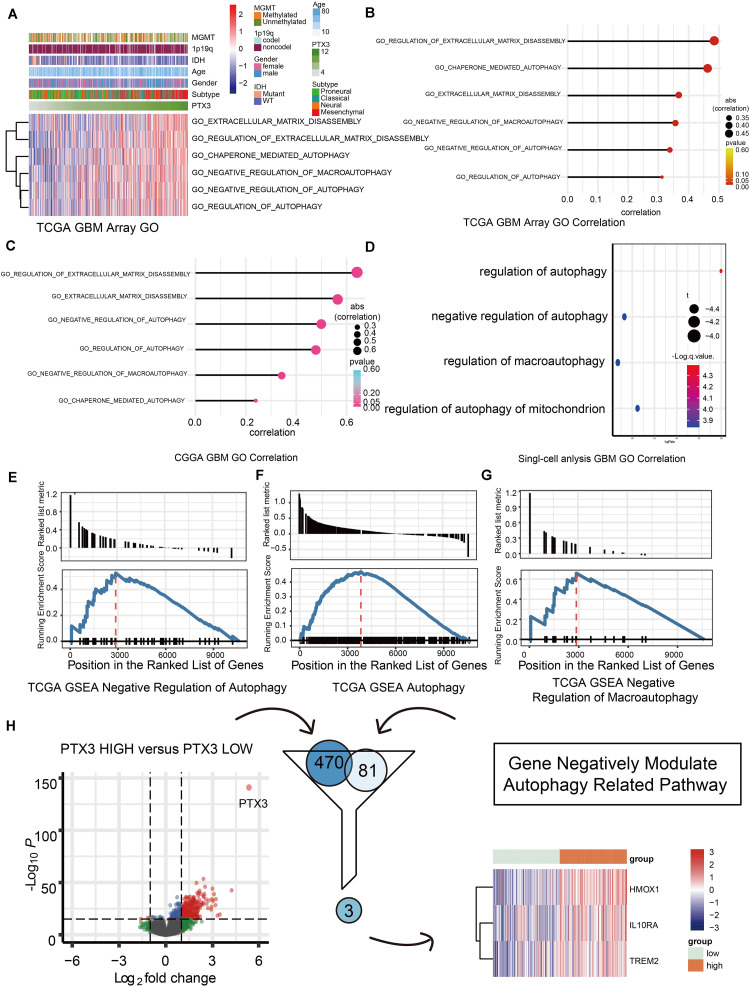
FIGURE 3.
Biofunction prediction based on PTX3 expression. (A) The distributions of clinical features and gene set enrichment of different pathways according to PTX3 expression in TCGA. Correlation analysis was performed between PTX3 expression and GO pathways in GBM from the TCGA microarray dataset (B), the CGGA dataset (C) and the single-cell analysis (D). GSEA plots for enrichment of negative regulation of autophagy (E), autophagy (F) and negative regulation of macroautophagy (G) in the TCGA dataset. (H) Three genes, HMOX1, IL10RA, and TREM2, are obtained by intersecting DEGs and genes involve in negative modulating autophagy.

