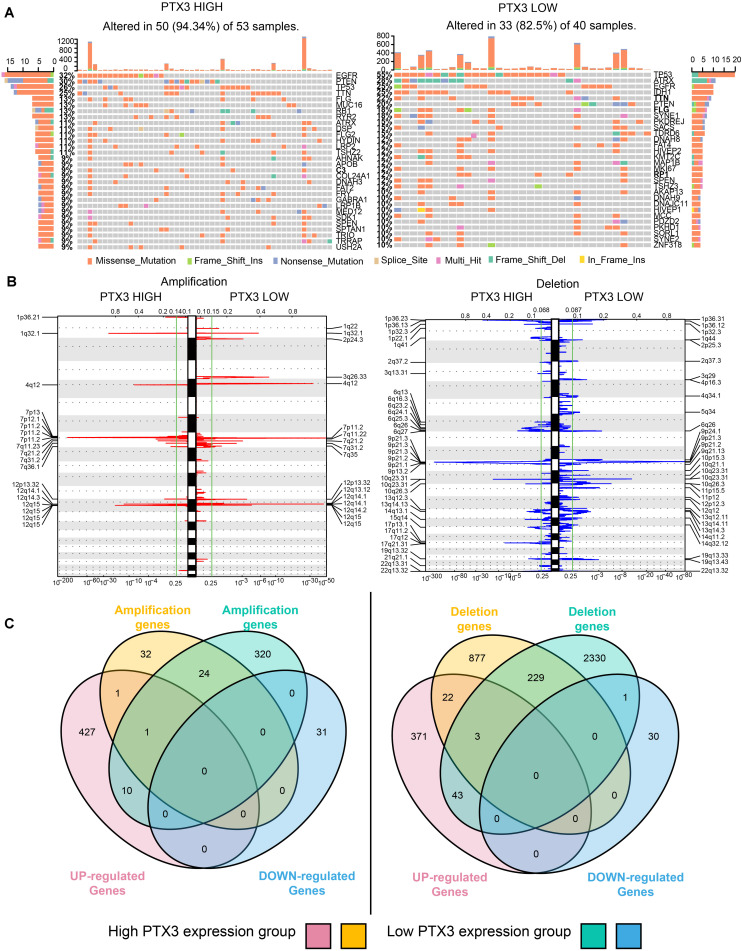
FIGURE 7.
PTX3 high or low expression is associated with genomic alterations. (A) SNPs based on high and low PTX3 expression in GBM. (B) Frequency of chromosomal deletion (blue) or amplification (red) generated by GISTIC2.0 analysis and stratified by PTX3 expression. (C) Venn diagrams demonstrating the overlap regions of gene which is significant amplification (left) or deletion (right) in either PTX3 high or low expression, as well as the intersection with differential gene profiles.

