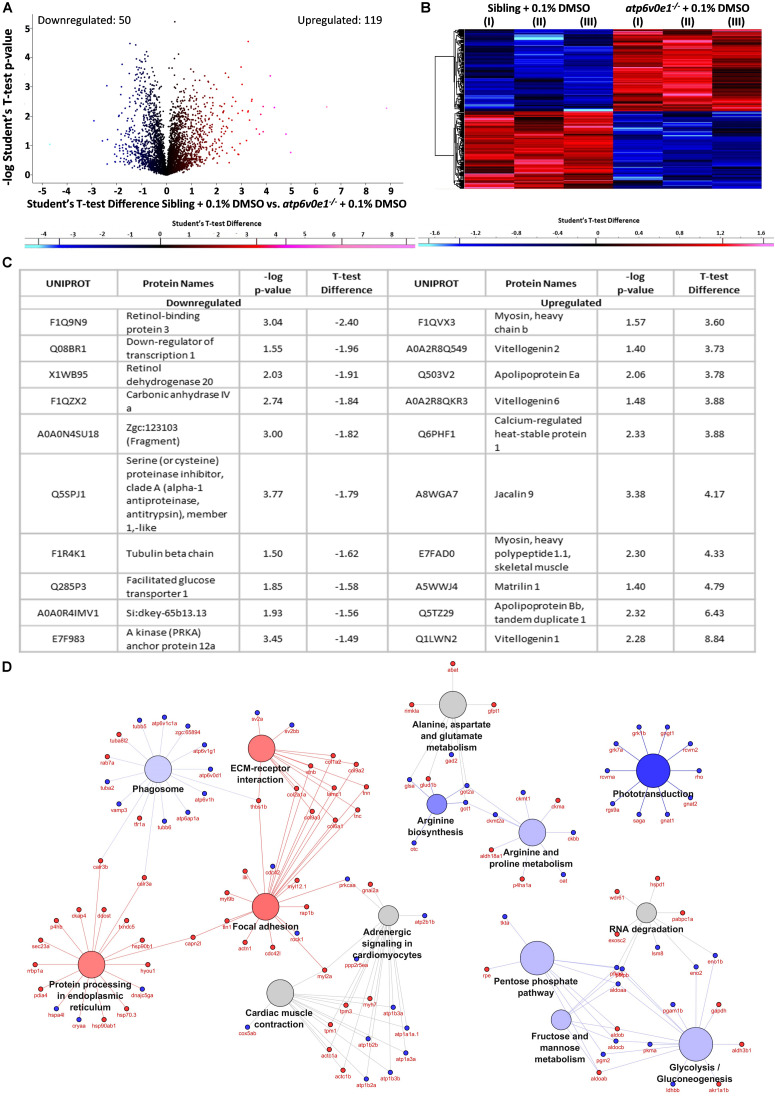
FIGURE 7.
Multiple pathways are implicated in the disease pathomechanism of atp6v0e1–/– as identified by proteome profiling. (A,B) Volcano plot and heatmap representing 790 differentially expressed proteins between vehicle-control treated siblings and atp6v0e1–/–, out of which, 119 proteins were upregulated (in red) and 50 downregulated (in blue) significantly, given a cut-off of fold change ± 1.2 and –log p-value ≥ 1.3. Student’s T-Test was used for statistical analysis. (C) Table describing the top-most significantly downregulated and upregulated proteins. (D) KEGG pathway analysis of significantly downregulated and upregulated proteins in vehicle-control treated atp6v0e1–/– compared to vehicle-control treated siblings.

