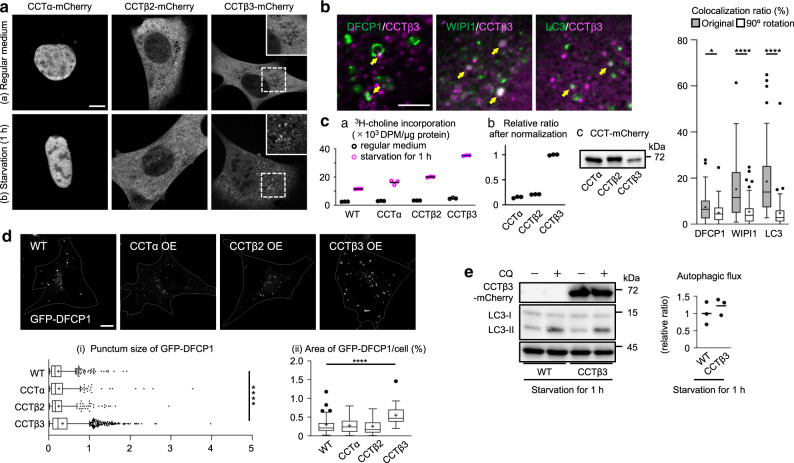
Fig. 3. CCT isoforms in MEFs starved for 1 h.
a Distribution of mCherry-tagged CCT isoforms in MEF. (a) Regular medium. (b) Starvation for 1 h. Bar, 10 μm. b Distribution of CCTβ3-mCherry (magenta) and Atg proteins (green) in MEFs starved for 1 h. Bar, 5 μm. The colocalization ratios of Atg proteins and CCTβ3-mCherry in the original picture (gray bar) and in the picture after 90° clockwise rotation of the green image (white bar) are shown. Pooled data obtained in three independent experiments (n = 60); *p = 0.0319, ****p < 0.0001 (two-tailed Mann–Whitney test). c PC synthetic activity. 3H-choline was added to medium 30 min before harvest. (a) MEFs with or without CCT overexpression cultured in regular medium or starvation medium for 1 h. (b) The result in starvation medium is normalized by the expression level of CCT isoforms, estimated by the CCT-mCherry band intensity in western blotting (c). A representative result of three independent experiments. d The effect of CCT overexpression on GFP-DFCP1 in MEFs starved for 1 h. Bar, 10 μm. (i) The punctum size. The number of puncta counted: 578 (WT), 486 (CCTα), 481 (CCTβ2), and 2320 (CCTβ3). (ii) The total area in a cell. The number of cells counted: 90. Pooled data from three independent experiments. ****p < 0.0001 (two-tailed Mann–Whitney test). e The effect of CCTβ3 overexpression on the autophagic flux estimated by western blotting of LC3. MEFs were cultured for 1 h in starvation medium, with or without the addition of 20 μM chloroquine (CQ) for the last 30 min. A representative result of three independent experiments. In box plots, the center line indicates the median, box boundaries indicate the 25th and 75th percentiles, whiskers are Tukey-type, and the average is marked as +. Source data are provided as a Source data file.

