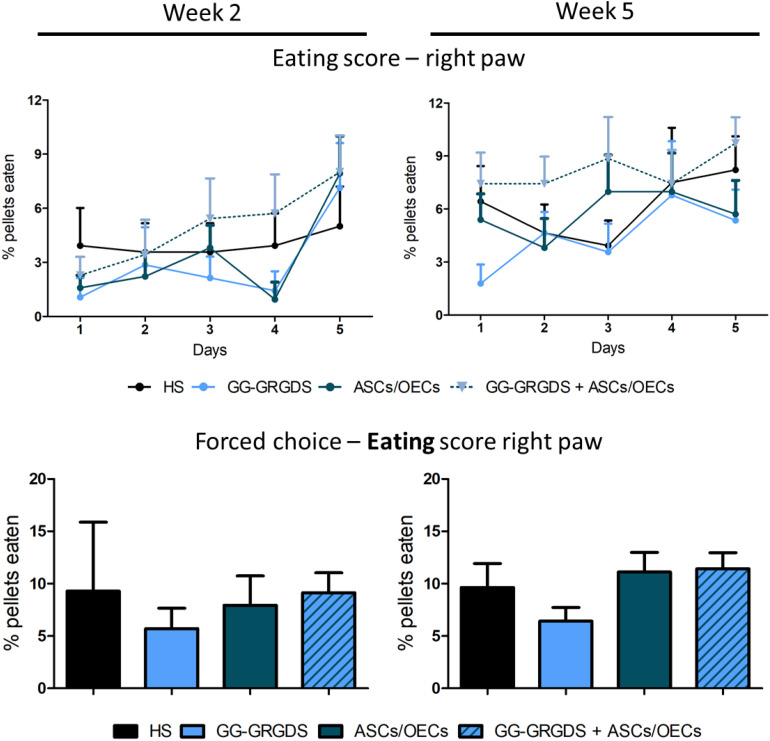
FIGURE 5.
Staircase test for the right paw, performed at 2 and 5 weeks after injury. There are no significant differences among groups in none of the time points evaluated, for both the staircase test (upper graphs) and the forced choice task of the test (bottom graphs). Data is presented as mean ± SEM (n = 8–10 per group).

