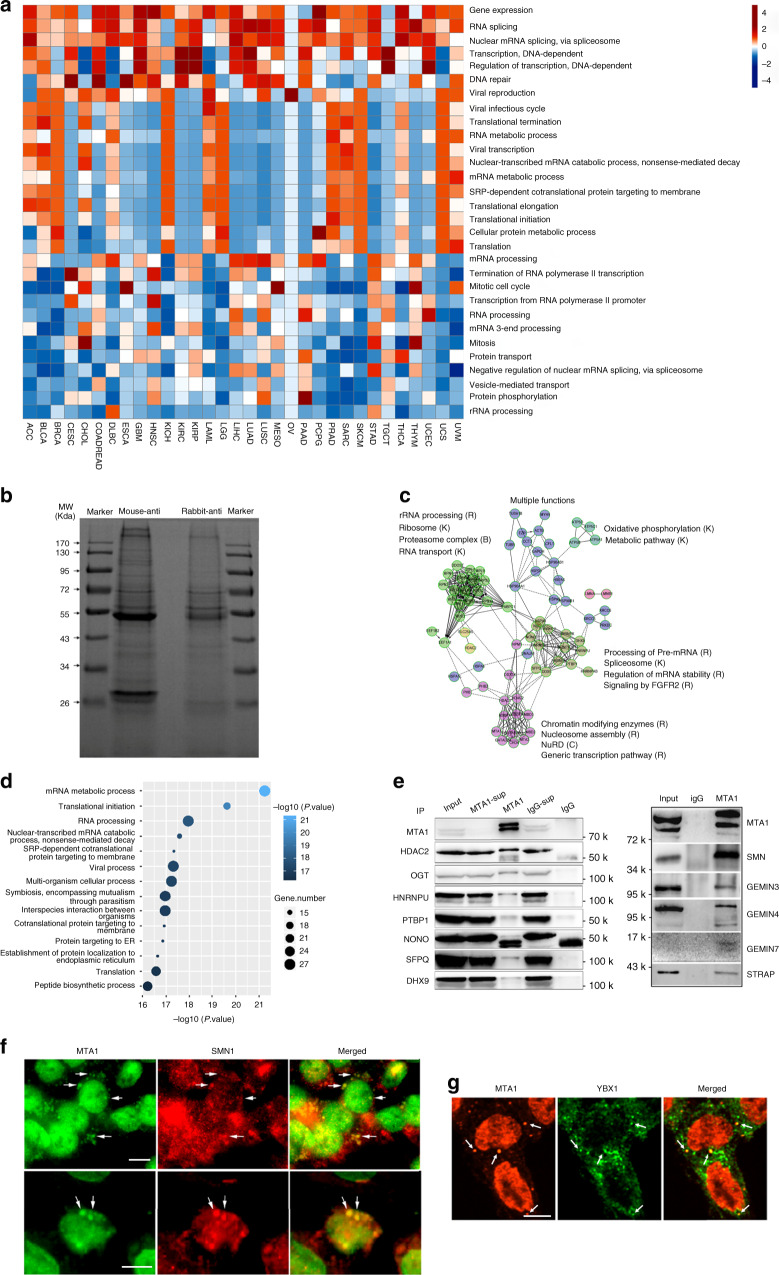
Fig. 1. MTA1 coexpresses and interacts with RBPs in cancer.
a Comprehensive functional landscape of the MTA1 coexpressing genes generated from a panel of 32 TCGA transcriptome datasets revealing a consistent enrichment in RNA processes. Functional enrichment analysis was performed using DAVID 6.8 database. b SDS-PAGE separation of the MTA1 interacting proteins captured by mouse- and rabbit- specific antibodies against MTA1 in HCT116 cells. c Network presentation of the functional clusters enriched by the MTA1 interacting proteins. A reactome analysis was performed for the MTA1 interacting proteins identified by both antibodies. d A functional enrichment analysis of the overlapping 57 RBPs using DAVID 6.8 database. e Co-IP and Western blot identification analyses of the MTA1 interacting RBPs. The HDAC2 and OGT coimmunoprecipitation with MTA1 is also shown. Sup, supernatant. f Immunofluorescence co-localization of MTA1 (green) and SMN (red) after UV irradiation. g Immunofluorescence co-localization of MTA1 and YBX1. Results in b, e–g are representative of three independent repeats with similar results. Scale bar = 10 µm for f and g.

