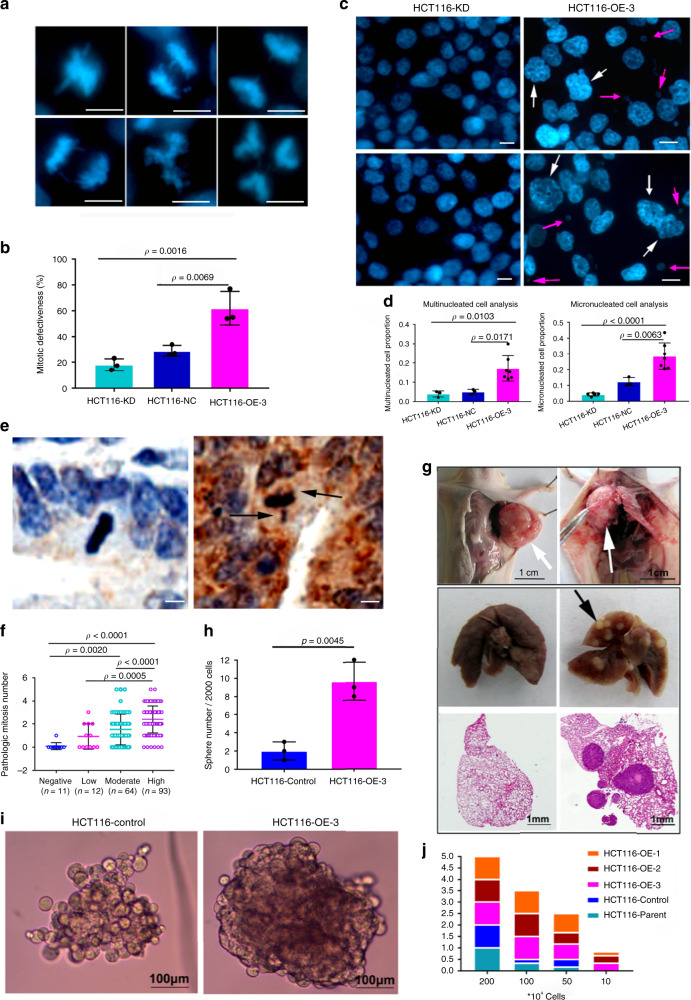
Fig. 7. MTA1 overexpression leads to CIN and tumorigenesis.
a, b Microscopic detection of mitotic defectiveness in HCT116 cell lines with MTA1 deletion or overexpression (n = 3 per group). MTA1 overexpression generated more mitotic defectiveness, including chromosome lagging, bridging, misalignment and multipolarized chromosomes. c, d Microscopic visualization of chromosomal instability in HCT116 cell lines with MTA1 deletion or overexpression. MTA1 overexpression resulted in a significantly higher occurrence of both multinucleated (c white arrow) and micronucleated (c; pink arrow) HCT116 cells. For multinucleated cell analysis, n = 3 except OE-3 in which n = 7; For micronucleated cell analysis, KD (n = 5), NC (n = 3) and OE-3 (n = 7). e Representative IHC images showing normal mitosis in MTA1-low colon cancer tissue (left) and pathological mitosis (black arrow) in MTA1-high colon cancer tissue (right). f The number of pathological mitosis cells in cancer tissues with negative, low, moderate or high MTA1 level. g Obvious pleura invasion (white arrow) and pulmonary metastases (black arrow) were found in the mice injected with the MTA1-overexpressing HCT116 cells but not in the control group. h The MTA1 overexpressing cells formed more single cell-derived tumor stem cell-like spheres than the control (n = 3 per group). i Two representative images showed that the spheres formed from the MTA1-overexpressing HCT116 cells were morphologically larger, rounder and tighter than those from the control cells. j Cumulative bar diagram showing the tumor occurrence rate of each group. All the cell lines initiated 100% tumors when injected with 2*106 cells, while when injected 1 × 10⁵ cells, only the MTA1-overexpressing cell lines initiated tumors. b, d and f One-way ANOVA with Tukey’s multiple comparisons test. h, two-tailed Student’s t test. All error bars represent mean ± SD. Results in a, c, e, g and i are representative of three independent repeats with similar results. Scale bar = 10 µm for a, c and e.

