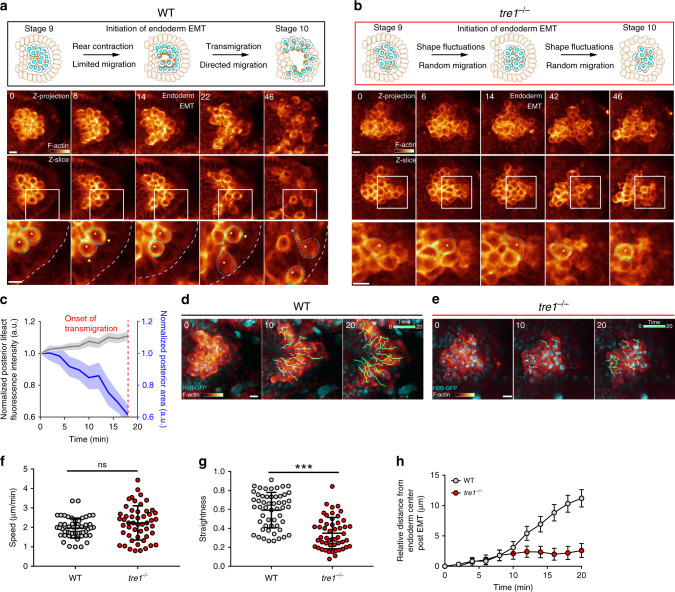
Fig. 1. PGC morphology and migratory behavior during cluster dispersal.
Two-photon timelapse imaging of representative WT and tre1−/− PGC clusters from stage 9 to stage 10 of embryogenesis with a schematic (top) of morphological changes occurring in WT (a) and tre1−/− (b) PGC clusters and endoderm. Lifeact-tdTomato is presented in a pseudocolor and a corresponding color bar is shown in the first frame (intensity ranges: 979–13,000 (a), 184–4000 (b)). The top row of images is a maximum intensity projection, while the next row is a single Z slice, with a white rectangle indicating the region expanded in the bottom row. Blue arrows indicate F-actin foci at the posterior while yellow arrows highlight F-actin pulses at the anterior. White asterisk and cyan outlines track individual PGCs shown in Supplementary movies 2 (a) and 4 (b). Representative images are from n = 6 embryos in (a) and n = 5 embryos in (b). Times indicated are in minutes. Scale bars, 10 μm. c Quantification of normalized posterior lifeact-tdTomato intensity and area over time. n = 25 PGCs from 6 embryos. Error bars show SEM. Two-photon timelapse imaging of representative WT (d) or tre1−/− (e) PGC clusters expressing life act-tdTomato and H2B-GFP after the onset of endoderm EMT. Lifeact-tdTomato is presented in a pseudocolor and a corresponding color bar is shown in the first frame (intensity ranges: 60–15693 (d), 36–3075 (e)). White squares mark nuclei being tracked over time. Tracks are shown as a temporal gradient from cyan to green. Representative images are from n = 4 embryos in (d) and (e). Times are in minutes. Scale bars, 10 μm. Quantification of speed (f), straightness (g), and distance from the endoderm center over time (h) of WT (n = 53 PGCs from 4 embryos) and tre1−/− (n = 51 PGCs from 4 embryos) PGCs after endoderm EMT. Data are presented as mean values ± SD in (f, g). Error bars are SEM in (h). Statistical comparisons are from a Mann–Whitney test in (f, g) with p < 0.0001 in (g). ***p < 0.001. Source data in (c, f, g and h) are provided as a Source Data file.

