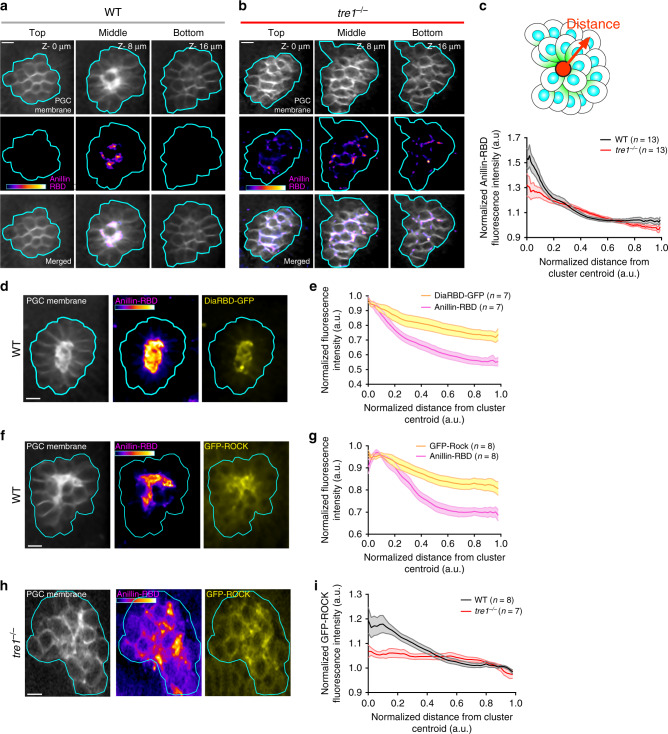
Fig. 2. The RhoA signaling pathway is active at sites of PGC separation.
Two photon imaging of a representative WT (a) or tre1−/− (b) PGC cluster expressing Anillin-RBD. Three different Z slices at the indicated depth relative to the first slice are shown. The Anillin-RBD is pseudocolored with the color bar within the image (intensity range: 664–2175 in (a, b). Representative images are from n = 16 embryos in (a) and n = 14 embryos in (b). c Quantification of normalized Anillin-RBD intensity relative to distance from the cluster centroid in WT and tre1−/− PGC clusters. Number of clusters are indicated. Shaded region represents SEM. Two photon imaging of a single Z slice from a representative WT PGC cluster expressing the Anillin-RBD and Dia-RhoA-GTP Binding Domain (RBD)-GFP (d) or GFP-ROCK (f). The Anillin-RBD is pseudocolored with the color bar within the image (intensity ranges- 1747–3903 in (d), 1429–3820 in (f). Representative images are from n = 7 embryos in d and n = 8 embryos in (f). Quantification of normalized fluorescence intensity of Anillin-RBD and DiaRBD-GFP (e) or GFP-ROCK (g) in PGC clusters relative to the distance from the cluster centroid. Values are normalized to max intensity. Shaded region represents SEM. h Two photon imaging of a single Z slice from a representative tre1−/− PGC cluster expressing Anillin-RBD and GFP-ROCK. Anillin-RBD is pseudocolored with the indicated color bar in the image (Intensity range = 540–2346). Representative images are from n = 7 embryos in (h, i) Quantification of normalized fluorescence intensity of GFP-ROCK in WT and tre1−/− PGC clusters relative to the distance from the cluster centroid. Values are normalized to background in (c, i). Number of clusters are indicated. Shaded region represents SEM. All scale bars, 10 μm. Source data in (c, e, g and i) are provided as a Source Data file.

