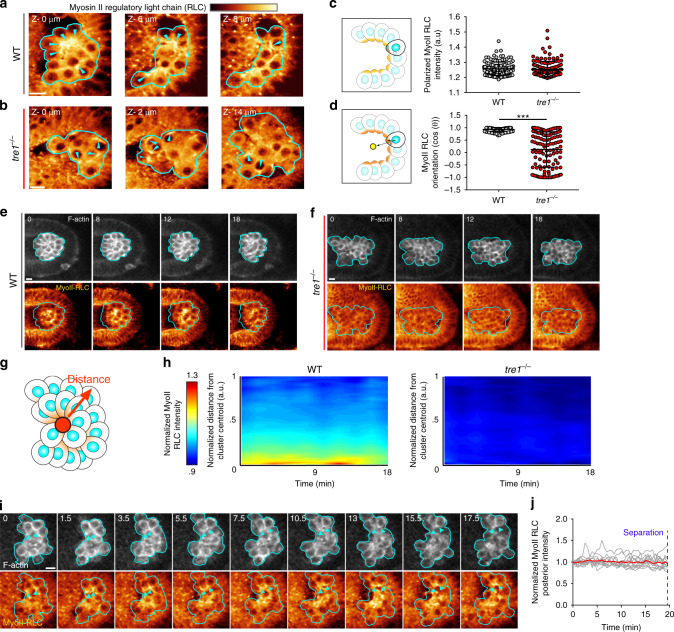
Fig. 3. Myosin II polarity is collectively oriented and remains persistent during separation.
a, b Two-photon imaging of myosin II-RLC GFP in a representative WT (a) or tre1−/− (b) cluster. Myosin II-RLC is pseudocolored with the indicated color bar on top (intensity ranges: 2319–4005 (a) and 2203–3803 (b)). Different Z slices with indicated depth relative to the first slice are shown. Cyan arrows indicate regions of myosin II-RLC accumulation. Representative images are from n = 15 embryos in (a) and n = 13 embryos in (b). c, d Quantification of polarized myosin II RLC intensity (c) and myosin II RLC orientation (d) in WT (n = 123 from 15 embryos) or tre1−/− (n = 127 from 13 embryos) PGCs. Data are presented as mean values ± SD. Statistical comparisons are from a Mann–Whitney test in (d) with p < 0.0001. ***p < 0.001. Two-photon timelapse imaging of a representative WT (e) or tre1−/− (f) PGC cluster expressing lifeact-tdTomato and myosin II RLC-GFP for 18 min prior to endoderm EMT. Myosin II-RLC is pseudocolored with the indicated color bar above (a) (intensity ranges: 1072–2171 (e), 3198–7726 (f)). A single Z slice is shown. Representative images are from n = 6 embryos in (e and f). g Schematic of how intensity vs. distance from cluster centroid is calculated. h Quantification of the average myosin II RLC intensity vs. distance from the cluster centroid over time in WT (n = 6 embryos) and tre1−/− (n = 6) PGC clusters. i Two photon timelapse imaging of a representative WT PGC cluster expressing lifeact-tdTomato and myosin II RLC-3xGFP over time. Myosin II-RLC is pseudocolored with the indicated color bar on top of (a) (intensity range: 2560–5624). A single Z slice is shown. Cyan arrows indicate regions of myosin II RLC accumulation from the same pair of cells. Representative images are from n = 5 embryos. j Quantification of myosin II RLC-3xGFP intensity at the posterior over time. Grey curves show single cells while the red curve indicates the mean. n = 13 PGCs from 5 embryos. All scale bars, 10 μm. All times are in minutes. Source data in (c, d, h and j) are provided as a Source Data file.

