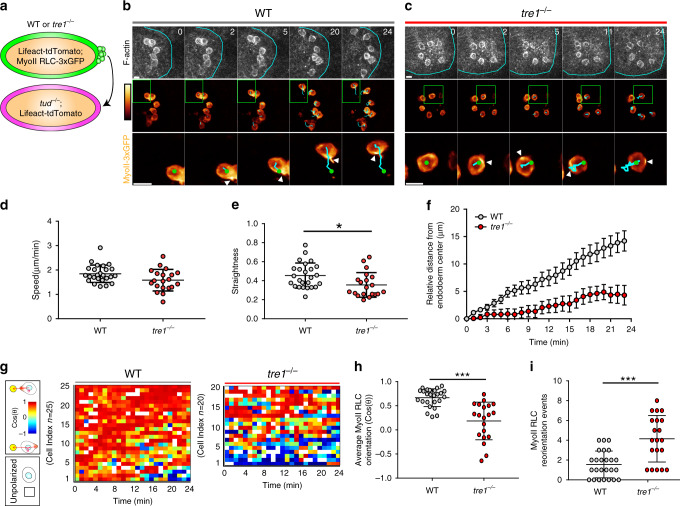
Fig. 4. Migration machinery is stabilized and oriented to drive PGC detachment.
a Schematic describing transplantation of PGCs with the indicated genotypes into embryos genetically devoid of PGCs. Two photon timelapse imaging of representative transplanted WT (b) and tre1−/− (c) PGCs. Cyan outlines the endoderm in the top set of panels. Myosin II RLC-3xGFP is pseudocolored with color bar indicated on the left (intensity ranges: 793–3616 (b), 801–3509 (c)). Green box indicates expanded region on the bottom row of images. Green circles mark nuclei, cyan lines indicate cell tracks, and white arrows highlight regions of myosin II RLC-3xGFP accumulation. Representative images are from n = 10 embryos in (b) and n = 14 embryos in (c). Times are in minutes. Scale bars, 10 μm. Quantification of speed (d), straightness (e), and relative distance from the endoderm center (f) for transplanted WT (n = 25 PGCs from 10 embryos) and tre1−/− (n = 20 PGCs from 14 embryos) PGCs. Data are presented as mean values ± SD in (d, e). Error bars are SEM in (f). Statistical comparisons are from a Mann–Whitney test in (e) with p = 0.0149. *p = 0.05. g Quantification of myosin II RLC 3xGFP polarity angles in single WT or tre1−/− PGCs. Each row shows the angles of a single cell over time. Polarity angles are pseudocolored as indicated on the left with the yellow circle representing the endoderm center, while a white box indicates when no polarity was detected. Quantification of average Myosin II RLC orientation (h) and Myosin II RLC reorientation events (i) (Shift > 60°) in WT (n = 25 PGCs from 10 embryos) and tre1−/− (n = 20 PGCs from 14 embryos) PGCs. Data are presented as mean values +/− SD. Statistical comparisons are from a Mann–Whitney test with p < 0.0001 in h and p = 0.0002 in (i). ***p < 0.001. Source data in (d–i) are provided as a Source Data file.

