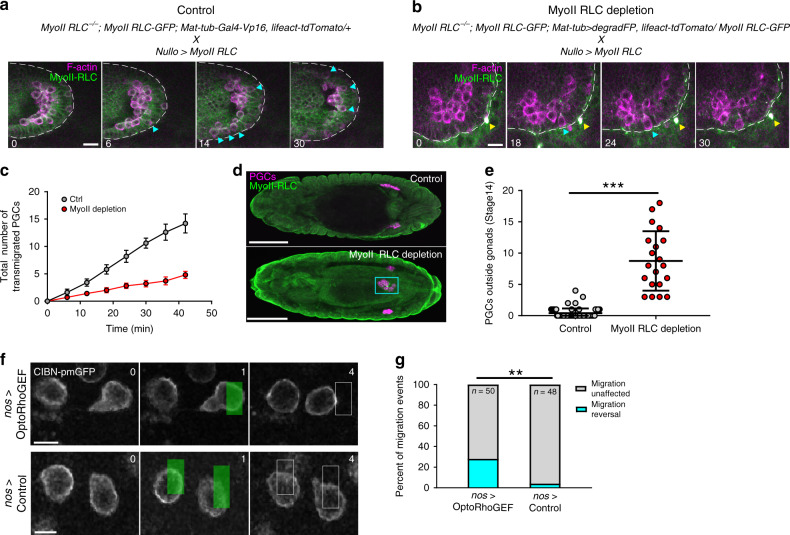
Fig. 5. Myosin II is necessary for PGC dispersal and its local accumulation can redirect migration.
a, b Two photon timelapse imaging of a representative control and Myosin II RLC depleted PGC cluster for 30 min after endoderm EMT. A single Z slice is shown. White dotted lines trace the boundary of the endoderm. Cyan arrows indicate PGCs which have transmigrated. Yellow arrow indicates a myosin II RLC-GFP inclusion body, which has been observed previously after degradation. Representative images are from n = 5 embryos in (a) and n = 10 embryos in (b). Times are in minutes. Scale bars, 10 μm. c Quantification of the total number of PGCs which have transmigrated over time under the indicated conditions. n = 10 embryos for myoII depletion and n = 5 embryos for control. Error bars are SEM. d Representative confocal images of immunostained stage 14 embryos under the indicated conditions. Representative images are from n = 65 embryos in control and n = 20 embryos in myoII depletion. Scale bars, 100 μm. e Quantification of the number of PGCs outside the gonad at stage 14 of embryogenesis. n = 65 control embryos and n = 20 myoII RLC depletion embryos. Data are presented as mean values +/− SD. Statistical comparisons are from a Mann–Whitney test with p < 0.0001. ***p < 0.001. f Two photon timelapse imaging of representative PGCs expressing the OptoRhoGEF (RhoGEF2-CRY2-mCherry, CIBn-pmGFP) system (top) or control (CIBnpmGFP) (bottom) migrating to the anterior (right) at stage 11 of embryogenesis. A single Z slice is shown. Green box indicates region which was pulsed with 950 nm light. The white rectangle in the following frame indicates the position of the pulse at time t = 1. Representative images are from n = 9 embryos in OptoRhoGEF and n = 10 embryos in control. Times are in minutes. Scale bars, 10 μm. g Quantification of the percent of migration events which occur after a blue light pulse under the indicated condition. Number of pulses are indicated. n = 27 PGCs from 9 embryos for OptoRhoGEF and n = 25 PGCS from 10 embryos for control. Statistical comparisons are from a Fisher’s exact test with p = 0.0019. **p < 0.01. Source data from (c, e and g) are provided as a Source Data file.

