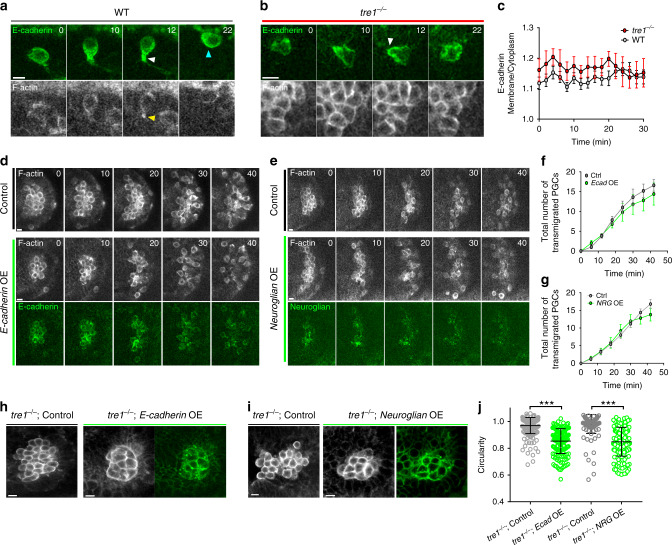
Fig. 6. PGC disperse without altering E-cadherin levels and can overcome increased adhesion.
Two-photon timelapse imaging of representative transplanted WT (a) or tre1−/− (b) PGCs expressing E-cadherin-3xGFP and lifeact-tdTomato within lifeact-tdTomato expressing WT (a) or tre1−/− (b) embryos. White arrow marks region of E-cadherin enrichment and yellow arrow marks an F-actin focus. Cyan arrow marks posterior where E-cadherin remains enriched after separation is complete. Representative images are from n = 7 embryos in (a) and n = 5 embryos in (b, c) Quantification of E-cadherin membrane/cytoplasm ratio in transplanted WT (n = 16 PGCs from 7 embryos) and tre1−/− (n = 9 PGCs from 5 embryos). Error bars are SEM. Two-photon timelapse imaging of a representative control (top panels), E-cadherinmClover2 (d) overexpressing (bottom panel), or Neuroglian-mClover2 (e) overexpressing (bottom panel) PGC cluster for 40 min post endoderm EMT. Representative images in (d) and (e) are from n = 5 embryos in both control and experiment. f–g Quantification of the total number of PGCs which have transmigrated in control (n = 5 embryos) vs. E-cadherin-mClover2 overexpressing (n = 5 embryos) (f) or control (n = 5 embryos) vs. Neuroglian-mClover2 overexpressing (n = 5 embryos) (g) for 40 min after endoderm EMT. Error bars are SEM. Representative Z slice from tre1−/− control (left), tre1−/− Ecadherin mClover2 overexpressing (h), or tre1−/− Neuroglian mClover2 overexpressing (i) PGC cluster. Representative images in (h) are from n = 7 embryos in control and n = 8 embryos in experiment. Representative images in (i) are from n = 6 embryos in control and n = 9 embryos in experiment. j Quantification of the circularity of tre1−/− PGCs under the following conditions-control (n = 220 PGCs from 7 embryos) vs. Ecadherin-mClover2 overexpression (n = 166 PGCs from 8 embryos) and control (n = 155 PGCs from 6 embryos) vs. NeuroglianmClover2 overexpression (n = 179 PGCs from 9 embryos). Data are presented as mean values +/− SD. Statistical comparisons are from a Mann–Whitney test with p < 0.0001 in both comparisons. ***p < 0.001. All times are in minutes. All scale bars, 10 μm. Source data from (c, f, g and j) are provided as a Source Data file.

