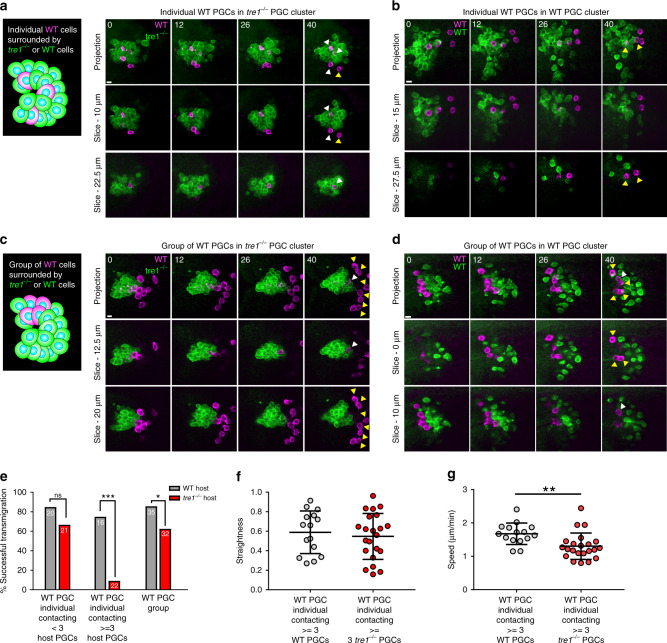
Fig. 7. Coordination is necessary for efficient cluster dispersal.
Two-photon timelapse imaging of representative transplanted individual WT PGCs into tre1−/− (a) or WT (b) hosts or transplanted group of WT PGCs (Defined by 3 or more contacting PGCs) in tre1−/− (c) or WT (d) hosts. Transplanted PGCs are marked with lifeacttdTomato while host PGC clusters express Moesin-actin binding domain (ABD)-GFP. Top row of images is a maximum intensity projection while bottom two rows show a Z slice at the indicated depth from the top of the cluster. White arrows mark PGCs which have not detached from the cluster while yellow arrows mark PGCs which have detached and transmigrated. Representative images are from n = 22 embryos in (a, c) and n = 14 embryos in (b, d). Scale bars, 10 μm. (e) Quantification of successful transmigration events from transplanted individual WT PGCs (left and middle set of columns) and WT PGC groups (right set of columns). Different hosts are color coded. The number of PGCs in each group is indicated on the bars taken from n = 14 WT host embryos and n = 22 tre1−/− host embryos. Statistical comparisons are from a Fisher’s exact test with p < 0.0001 in the central comparison and p = 0.0478 in the comparison on the right. ***p < 0.001 and *p <0.05. Quantification of straightness (f) and speed (g) of transplanted WT PGCs contacting > = 3 WT (n = 15 from 14 embryos) or tre1−/− PGCs (n = 22 PGCs from 22 embryos). Data are presented as mean values +/– SD. Statistical comparisons are from a Mann-Whitney test in (g) with p = 0.0021. **p < 0.01. Source Data from (e–g) is provided as a Source Data file.

