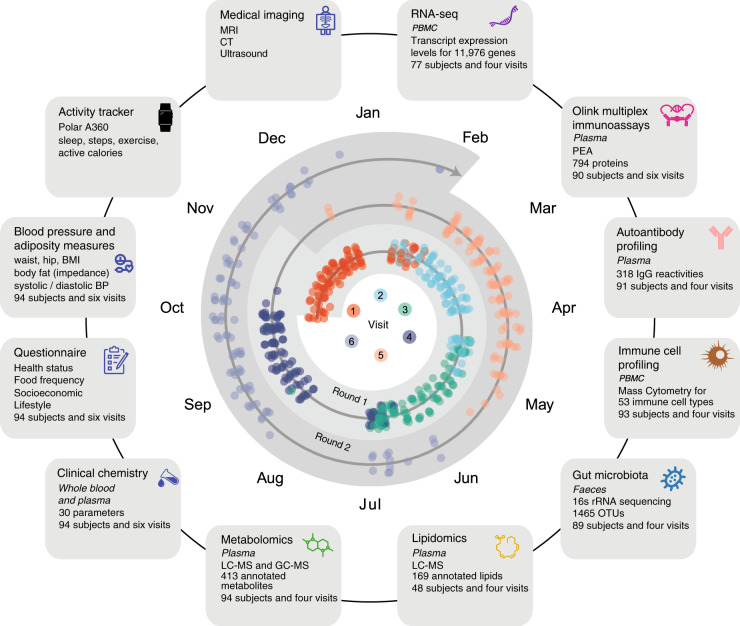
Fig. 1. Overview of the S3WP program.
The outer part represents all types of data that have been analyzed for this study. The inner part shows the distribution across the months of a year for all visits for each of the 94 subjects that completed the program, where round one includes visits one to four with approximately three months intervals and round two includes visits 5 and 6 with ~6 months intervals. PBMC peripheral blood mononuclear cell; PEA Proximity Extension Assay; OTUs operational taxonomic units; IgG Immunoglobulin G; rRNA Ribosomal Ribonucleic Acid; LC–MS liquid chromatography–mass spectrometry; GC–MS gas chromatography–mass spectrometry; BP blood pressure; BMI body mass index; MRI Magnetic resonance imaging; CT computed tomography.

