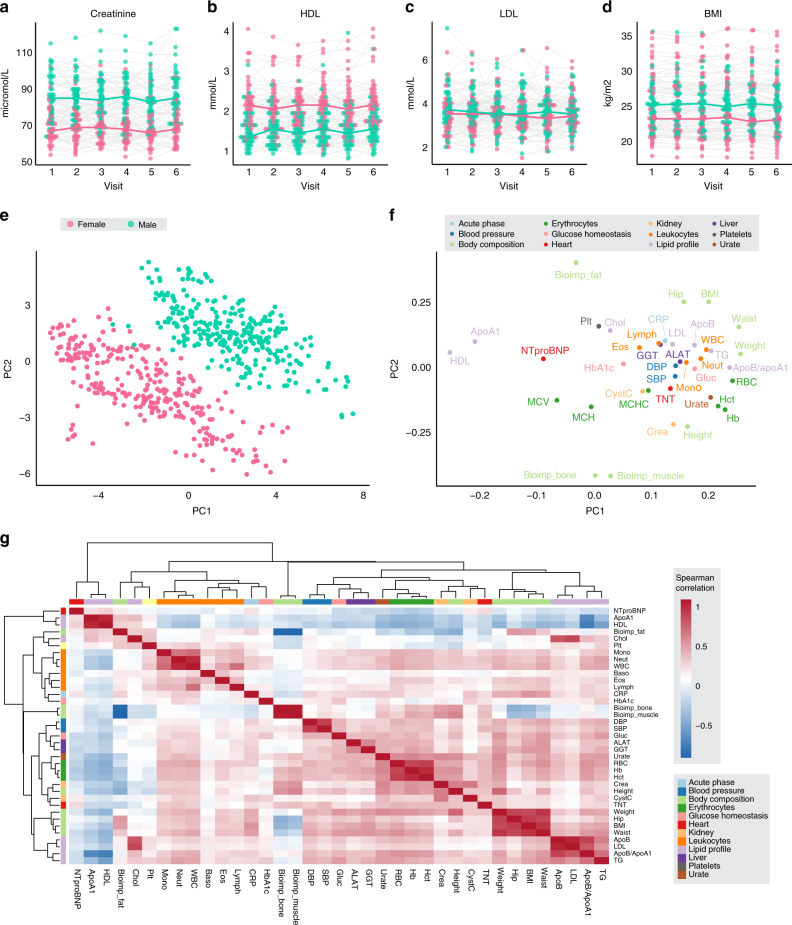
Fig. 2. Clinical chemistry and anthropometrics longitudinal variation.
Clinical chemistry variation across the six visits for 94 subjects in: a Creatinine, b high-density lipoproteins (HDL), c low-density lipoproteins (LDL), as well as the variation in d body mass index (BMI). The color indicates males and females, the colored lines visualize the medians for each visit and sex respectively, and each individual is connected by a gray line. Principal Component Analysis (PCA) based on data from visits 1–6 for 41 parameters including anthropometrics, clinical chemistry and hematology variables is visualized as e scores plot showing clear separation between males and females and f loadings plot showing the relationship between the underlying variables (Explained variance: PC1 = 23%, PC 2 = 13%). g Heatmap showing the pairwise Spearman correlations between 37 clinical chemistry and anthropometry variables.

