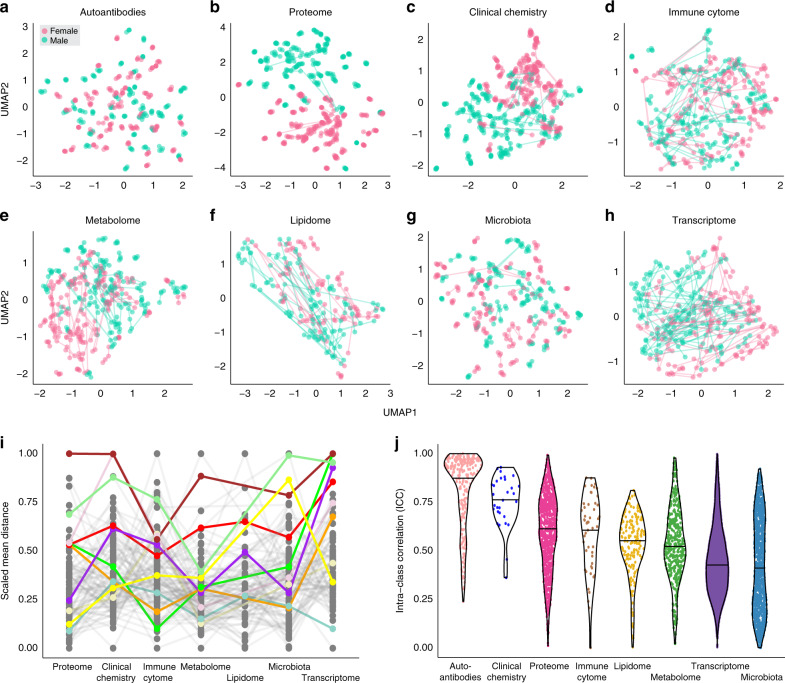
Fig. 3. Global molecular profiles and the individual variation.
The global profiles across visits were analyzed using UMAP for eight different datasets used in the study: a autoantibodies (n = 318) analyzed in plasma and based on 91 subjects; b plasma protein expression data for 794 proteins in 90 subjects; c clinical chemistry and hematology variables (n = 30) based on 94 subjects; d immune cell profiles from PBMC (n = 53) based on 93 subjects; e metabolites in plasma (n = 413) based on 94 subjects; f lipids in plasma (n = 169) based on 48 subjects; g fecal microbiota based on 16S sequencing and using 1465 operational taxonomic units (OTUs) for 89 subjects; and h PBMC transcriptome expression values from 11,976 genes based on 77 subjects. Each plot shows all individuals with complete data from all four visits for the respective datasets, except for the proteome and clinical chemistry data where six visits were analyzed, colored by sex and with lines connecting the visits for each individual. i The average distance between visits for each individual calculated per data type. The autoantibody profiling was excluded from this analysis due to the high stability over time. Euclidean distance was used for all methods except microbiota, which used Bray–Curtis distance, and immune cytome, which used Aitchisons distance. The individuals with the top ten largest average distances are highlighted in different colors and all others are shown in gray. j Intra-class correlation (ICC) levels in each variable from each dataset. In j data are represented as violin plots where the middle line is the median.

