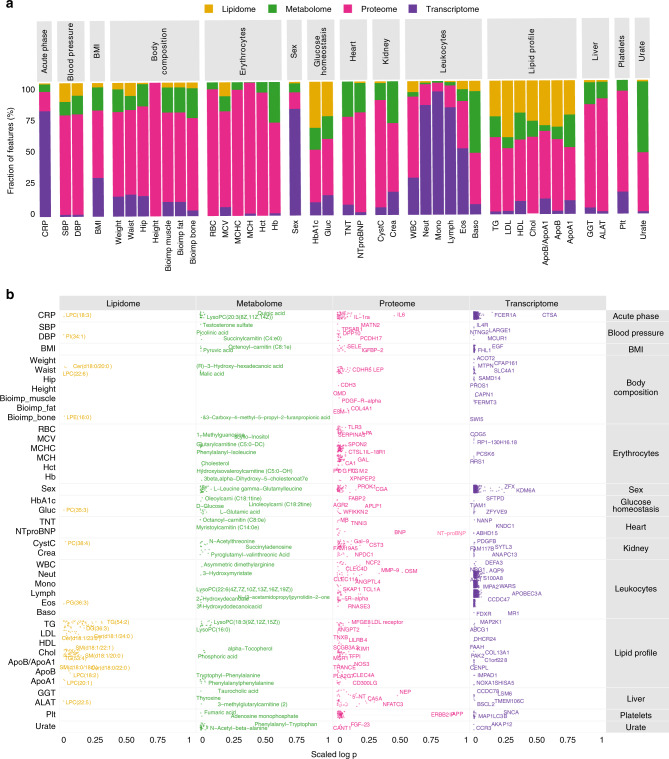
Fig. 5. Mixed-effect modeling of four omics datasets versus clinical parameters.
a Bar plot of the distribution of the most significant results from mixed-effect modeling for each of the clinical variables compared to features from the proteome, transcriptome, metabolome and lipidome. b Visualization of the top two most significant features for each clinical data across omics colored by omics type. Multiple test corrections have been applied for p values using Benjamini and Hochberg method. Number of samples: metabolome (n = 94), lipidome (n = 48), proteome (n = 90), transcriptome (n = 77).

