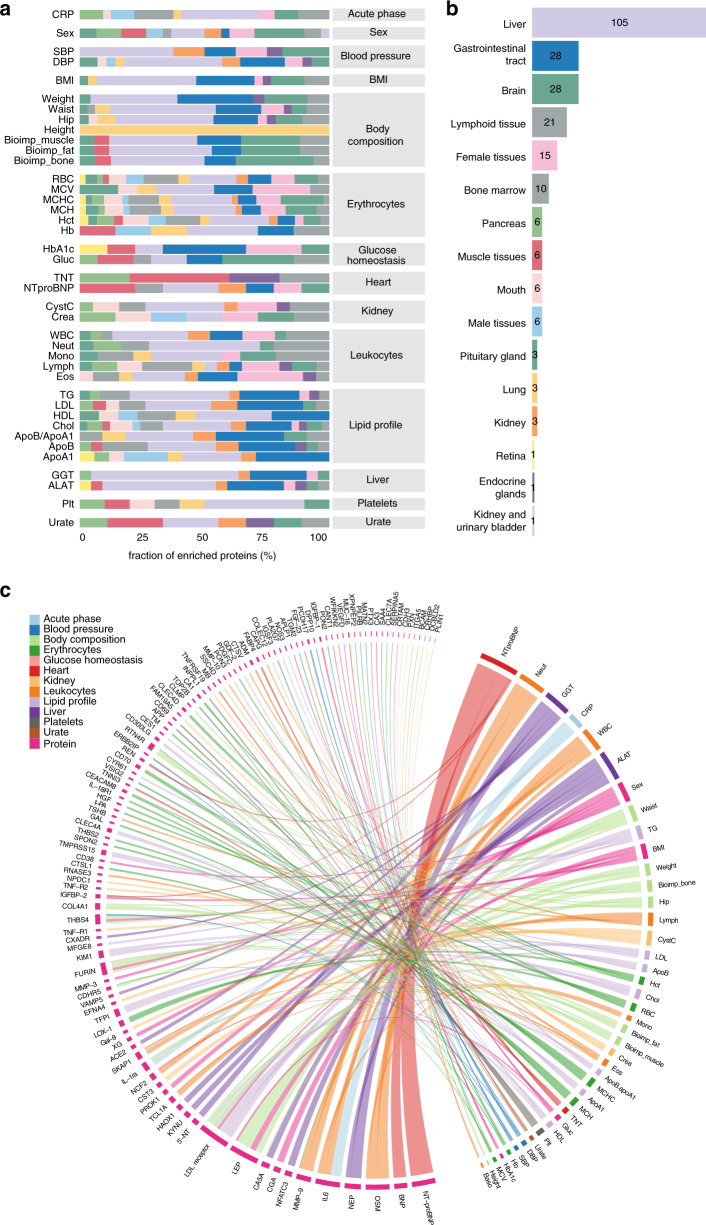
Fig. 6. Tissue enrichment analysis of the blood proteome retrieved from mixed-effect modeling.
Distribution of tissue enriched proteins in (a) each of the clinical parameters classified based on the tissue type and protein profiling results and using the color code in (b), with a bar plot showing the distribution of the number of tissue enriched proteins for each tissue type. c Chord diagram of the top five most associated proteins for each of the clinical parameters, colored by clinical variable class. The ribbon thickness is proportional to the -log adjusted p-value.

