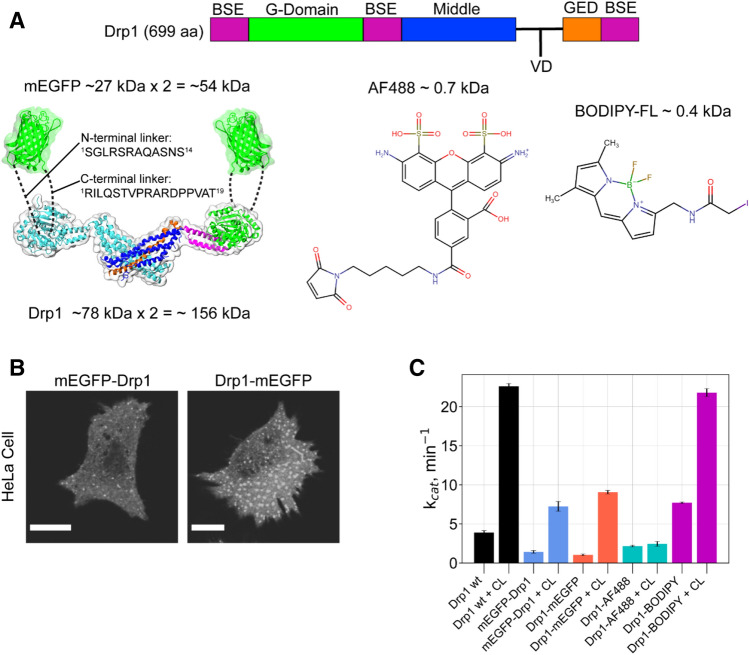
Figure 1.
GFP-tagging differentially influences Drp1 activity both in vitro and in vivo. (A) (left) Drp1 domain arrangement, and 3D structures of the minimal Drp1 dimer (PDB ID: 4BEJ) and mEGFP (PDB ID: 2Y0G) drawn to scale. A Drp1 monomer is color-coded in correspondence with the above domain arrangement. The sequences of the linkers connecting mEGFP to Drp1 at the N- and C-termini are shown and are illustrated by dashed lines. G GTPase domain; BSE bundle signaling element; VD variable domain; and GED GTPase effector domain. The structural models were prepared using VMD v1.9.334 available at https://www.ks.uiuc.edu/Research/vmd/. (right) Chemical structures of AF488 C5-maleimide and BODIPY-FL C1-iodoacetamide used for Drp1 surface-Cys fluorescence labeling. The chemical structures were prepared using MolView v2.4 available at https://molview.org/. (B) Confocal fluorescence images (shown in grayscale) of representative HeLa cells overexpressing either mEGFP-Drp1 (left) or Drp1-mEGFP (right). Numerous large cytosolic aggregates were observed for Drp1-mEGFP relative to mEGFP-Drp1. Images were prepared using the software platform Fiji35. Scale bars, 10 μm. (C) Basal (protein alone) and CL-stimulated GTPase activities of the various fluorescently labeled Drp1 constructs relative to Drp1-wt (0.5 μM protein final; 150 μM total lipids final). Calculated GTP turnover numbers (kcat, min-1) are an average of three experiments ± S.D. Bar plots were prepared using matplotlib v3.2.2 available at https://matplotlib.org/3.2.2/api/_as_gen/matplotlib.pyplot.boxplot.html.

